Hey Daniel,

Worked!! I just have the issue if the annotations being displayed above the
vAxis labes when the bar is to big, but i avoided that setting
"AlwaysOutSide" prop to false.
Thank you soooo much for your patience and help!!
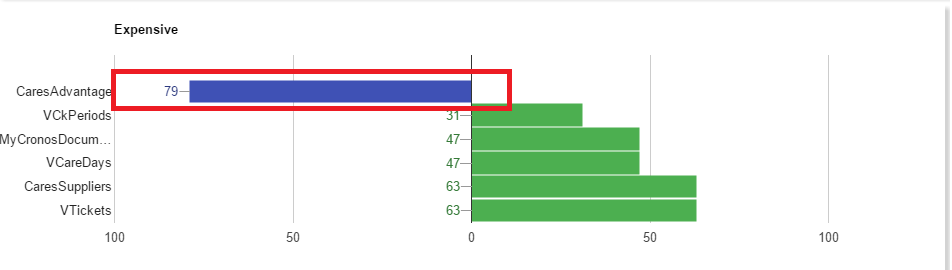
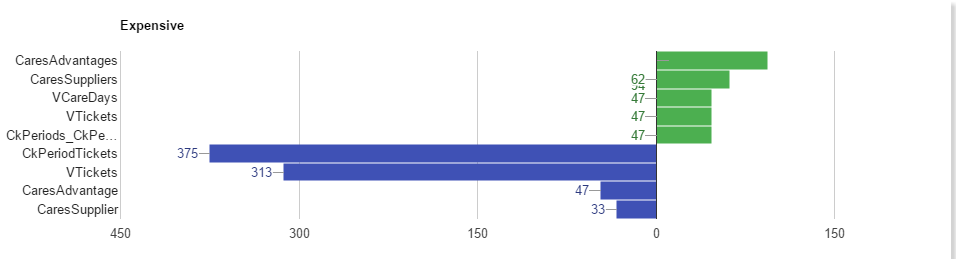
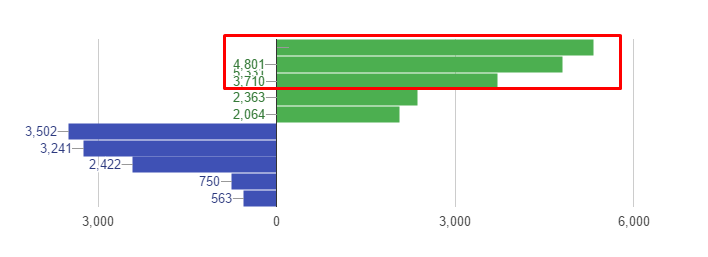
Best regards,

2016-11-29 14:17 GMT+00:00 'Daniel LaLiberte' via Google Visualization API <
[email protected]>:

> If you are reversing the vertical axis direction, then you would need to
> expand the viewWindow min instead of the max.  Try viewWindow: { min: -0.1 }
>
> On Mon, Nov 28, 2016 at 5:08 PM, Ricardo Costa <[email protected]>
> wrote:
>
>> Hey Daniel,
>>
>> Already tried another way..and close of what i want!! But i am having the
>> same issue with the annotations. Already set a max value for
>> vAxis.viewWindow and nothing. I checked your example, but i dont want
>> change the direction of my vAxis. Here is my code for the chart:
>>
>>     private _drawExpensiveChart(expensiveData: ExpensiveData[]) {
>>         const queryData = expensiveData[0].values;
>>         const persistentData = expensiveData[1].values;
>>
>>         const max = queryData.length + persistentData.length +1;
>>         const data = new google.visualization.DataTable();
>>         data.addColumn("string", "Name");
>>         data.addColumn("number", "Value");
>>         data.addColumn({ type: "string", role: "style" });
>>         data.addColumn({ type: "number", role: "annotation" });
>>         data.addColumn({ type: "string", role: "tooltip" });
>>
>>         //NOTE: Positive bars
>>         for (let i = 0; i < queryData.length; i++)
>>             data.addRow([queryData[i].label, queryData[i].value * -1,
>> "color: #4CAF50", queryData[i].value, `${queryData[i].label}\n Value:
>> ${queryData[i].value.toString().replace(/\B(?=(\d{3})+(?!\d))/g,
>> ",")}`]);
>>
>>         //NOTE: Negative bars
>>         for (let j = 0; j < persistentData.length; j++)
>>             data.addRow([persistentData[j].label,
>> persistentData[j].value * -1, "color: #3F51B5", persistentData[j].value *
>> -1, `${persistentData[j].label}\n Value: ${(persistentData[j].value *
>> -1).toString().replace(/\B(?=(\d{3})+(?!\d))/g, ",")}`]);
>>
>>         //NOTE: Chart options
>>         const options: google.visualization.BarChartOptions = {
>>             title: "Expensive",
>>             legend:
>>             {
>>                 position: "none"
>>             },
>>             bar:
>>             {
>>                 groupWidth: "90%"
>>             },
>>             animation:
>>             {
>>                 startup: true,
>>                 duration: 1000,
>>                 easing: "linear"
>>             },
>>             tooltip: {
>>                 textStyle:
>>                 {
>>                     bold: false
>>                 },
>>                 trigger: "selection"
>>             },
>>             hAxis: {
>>                 direction: -1
>>             },
>>             vAxis: {
>>                 viewWindow: {
>>                     max: max
>>                 },
>>                 gridlines: {
>>                     count: -1
>>                 }
>>             }
>>         };
>>
>>         // Missing alwaysOutside on interface
>>         options.annotations = {};
>>         options.annotations["alwaysOutside"] = true;
>>         //NOTE: Get the div tag and draw the chart
>>         const chart = new google.visualization.BarChart(
>> document.getElementById("expensiveChart"));
>>         chart.draw(data, options);
>> //Custom legends
>>         document.getElementById("legend").style.visibility = "visible";
>>     }
>>
>> Right now, by chart is like the image :(. Sorry for being bothering you
>> with this, but i am just trying to get same help from anyone that can help
>> me!
>> Any idea :/?
>> Regards,
>>
>>
>>
>> 2016-11-28 20:38 GMT+00:00 Ricky Costa <[email protected]>:
>>
>>> False alarm :(. Still having negative ticks...not working. I do not know
>>> what can i do more to fix this :(. Basically i am still having negative
>>> ticks while the chart is drawing...after it disappears! I need to have
>>> always positive ticks for my negative bars. Is that possible? I am start
>>> thinking that maybe its not possible do that :(. You can check that in the
>>> images...while drawing shows negative values...after drawing, shows the
>>> ticks to positive values like i want!
>>>
>>>
>>> <https://lh3.googleusercontent.com/-egjo-eDMOzU/WDyVwVWRzXI/AAAAAAAAAP4/md0ypCNnfJQW21y3qjfqWNkuSqXaBb7cQCLcB/s1600/barChart_issue_drawing.png>
>>>
>>>
>>> <https://lh3.googleusercontent.com/-vriQbecuXaI/WDyV0sDx_YI/AAAAAAAAAP8/TDH3I-xd5_MqHGdB_9fBeimUDG0KwTbbACLcB/s1600/barChart_issue_after_drawing.png>
>>>
>>>
>>> segunda-feira, 28 de Novembro de 2016 às 20:28:53 UTC, Ricky Costa
>>> escreveu:
>>>>
>>>>
>>>>
>>>> segunda-feira, 28 de Novembro de 2016 às 20:27:51 UTC, Ricky Costa
>>>> escreveu:
>>>>>
>>>>> Hey Daniel,
>>>>>
>>>>> Worked! But now i have another issue :(. Sometimes my left bars (when
>>>>> the value is big), have the annotation above of the vertical ticks.
>>>>> Any way of change the annotation to the other side of the bar?
>>>>> In the image its not happening that, but its possible have an idea
>>>>> about what happens when the value is bigger. Any way of avoid this :( ?
>>>>> Thank you very much for your help!!
>>>>> Regards
>>>>>
>>>>>
>>>>> <https://lh3.googleusercontent.com/-pNt1m1PGD7s/WDyS7cCMazI/AAAAAAAAAPs/YRV2NcPgwVYsFNWwJInGyiTJnkZ6UNroQCLcB/s1600/bars_issue.png>
>>>>>
>>>>>
>>>>> segunda-feira, 28 de Novembro de 2016 às 15:14:08 UTC, Daniel
>>>>> LaLiberte escreveu:
>>>>>>
>>>>>> Did you try adding a vAxis viewWindow.  In this case, since your
>>>>>> vertical axis values are discrete, the viewWindow max value should be
>>>>>> something like 8.1.  The first discrete value has a numeric value of 0
>>>>>> and
>>>>>> you have 9 values, 0-8.  Here is an example using a variant of the
>>>>>> previous
>>>>>> example I posted: https://jsfiddle.net/dlaliberte/wctwnro5/5/
>>>>>>
>>>>>> On Sun, Nov 27, 2016 at 12:29 PM, Ricky Costa <[email protected]>
>>>>>> wrote:
>>>>>>
>>>>>>> Hey Daniel,
>>>>>>>
>>>>>>> Sorry did not say nothing more about our topic, but i started
>>>>>>> working in another project and this one stayed in pause a little. I am
>>>>>>> now
>>>>>>> trying to fix that issue about the ticks. I had the idea of manipulate
>>>>>>> the
>>>>>>> values and after the direction of my hAxis. And its working! I dont have
>>>>>>> anymore my ticks with negative values while drawing the chart. But i
>>>>>>> have
>>>>>>> this issue that i show on the image. This happens when i set the
>>>>>>> direction:
>>>>>>> -1 on my hAxis.
>>>>>>>
>>>>>>>
>>>>>>> <https://lh3.googleusercontent.com/-Tcvwi3ZLE70/WDsXym8MBiI/AAAAAAAAAPY/TrTft8RcXdwp2QeppIkgiwwMuG6-gd0PgCLcB/s1600/annotation_issue.png>
>>>>>>>
>>>>>>>
>>>>>>> Basically what i did was multiply by -1 my negative values, and the
>>>>>>> same with my positive values. After i changed the direction of my vAxis
>>>>>>> (direction: -1) ..and the issue happens. Already tried like you said
>>>>>>> before...set a max value for my axis...did not work. Any idea :( ?
>>>>>>> Thank you for your help!
>>>>>>> Regards
>>>>>>>
>>>>>>>
>>>>>>> quinta-feira, 20 de Outubro de 2016 às 10:25:45 UTC+1, Ricky Costa
>>>>>>> escreveu:
>>>>>>>>
>>>>>>>> Hey Daniel,
>>>>>>>>
>>>>>>>> Thanks for your help! Gonna try that solution. I will let you know
>>>>>>>> if i did it :).
>>>>>>>>
>>>>>>>> Regards,
>>>>>>>>
>>>>>>>>
>>>>>>>> quarta-feira, 19 de Outubro de 2016 às 18:27:31 UTC+1, Daniel
>>>>>>>> LaLiberte escreveu:
>>>>>>>>>
>>>>>>>>> You can get the range of data with getColumnRange() (
>>>>>>>>> https://developers.google.com/chart/interactive/docs/refer
>>>>>>>>> ence#DataTable_getColumnRange )
>>>>>>>>> and then compute the ticks you need from that.  You'll probably
>>>>>>>>> want to round up the range to the nearest multiple of 1, 2, or 5
>>>>>>>>> times a
>>>>>>>>> power of 10.
>>>>>>>>>
>>>>>>>>> We should offer a way to specify a tick formatting function, so
>>>>>>>>> you could simply use the absolute value of whatever ticks are computed
>>>>>>>>> based on your data.
>>>>>>>>>
>>>>>>>>> On Wed, Oct 19, 2016 at 12:22 PM, Ricky Costa <[email protected]
>>>>>>>>> > wrote:
>>>>>>>>>
>>>>>>>>>> Hey Daniel,
>>>>>>>>>>
>>>>>>>>>> This works, but the problem is that my ticks are dynamic because
>>>>>>>>>> my values changes every minute. I am getting the values from a ajax
>>>>>>>>>> request
>>>>>>>>>> to a server.
>>>>>>>>>> Doing this, my ticks will always have the same values and won´t
>>>>>>>>>> match the values of the bars.
>>>>>>>>>>
>>>>>>>>>> Any way of dong this dynamically? I can´t share directly the code
>>>>>>>>>> because this project its not personal :(. I wish i could, would be
>>>>>>>>>> much
>>>>>>>>>> easier for you and for me.
>>>>>>>>>>
>>>>>>>>>> Regards,
>>>>>>>>>>
>>>>>>>>>> terça-feira, 18 de Outubro de 2016 às 16:23:31 UTC+1, Daniel
>>>>>>>>>> LaLiberte escreveu:
>>>>>>>>>>>
>>>>>>>>>>> You can specify a set of tick values and how they will be
>>>>>>>>>>> displayed, if that is your concern.  e.g.
>>>>>>>>>>>
>>>>>>>>>>>   hAxis: { ticks: [{v: -15000, f: '15,000'}, {v: -10000, f:
>>>>>>>>>>> '10,000'}, {v: -5000, f: '5,000'}, {v: 0, f: '0'}, {v: 5000, f:
>>>>>>>>>>> '5,000'}] }
>>>>>>>>>>>
>>>>>>>>>>> Here is an example: https://jsfiddle.net/dlaliberte/wctwnro5/3/
>>>>>>>>>>>
>>>>>>>>>>> It might be simpler if you could point me to your web page, or
>>>>>>>>>>> set up an example on jsfiddle.
>>>>>>>>>>>
>>>>>>>>>>>
>>>>>>>>>>> On Tue, Oct 18, 2016 at 11:09 AM, Ricky Costa <
>>>>>>>>>>> [email protected]> wrote:
>>>>>>>>>>>
>>>>>>>>>>>> Hi Daniel,
>>>>>>>>>>>>
>>>>>>>>>>>> Thank you for your example. Maybe i am not exposing corrrectly
>>>>>>>>>>>> my issue, i am new with this, sorry! Basically my problem its with
>>>>>>>>>>>> the
>>>>>>>>>>>> ticks and i tried solve it with all this values conversion and
>>>>>>>>>>>> direction
>>>>>>>>>>>> thing. What i am trying to solve its the following:
>>>>>>>>>>>>
>>>>>>>>>>>>
>>>>>>>>>>>> <https://lh3.googleusercontent.com/-Qs8Q_VcBVcs/WAY6Zh7RI4I/AAAAAAAAAOs/LrpYgyr9pVMpM6AXh1oonHPoeBZcqRFnwCLcB/s1600/expensiveChart1.png>
>>>>>>>>>>>>
>>>>>>>>>>>>
>>>>>>>>>>>> <https://lh3.googleusercontent.com/-lZF_5DdxRBA/WAY6czFctsI/AAAAAAAAAOw/-Eta1IGnWtk_9PzrBh6441xC6iL68FtuwCLcB/s1600/expensiveChart1b.png>
>>>>>>>>>>>> I am using a animation during my charts draw. During that
>>>>>>>>>>>> animation my ticks for the negative values are negatives..but i
>>>>>>>>>>>> want them
>>>>>>>>>>>> so be positive. Basically i want to have bars to the left and
>>>>>>>>>>>> right (to
>>>>>>>>>>>> negative and positive values) but with positive values for the
>>>>>>>>>>>> ticks. Check
>>>>>>>>>>>> my images please. The first image, to the left bars the ticks are
>>>>>>>>>>>> negative
>>>>>>>>>>>> during the animation. When the animation finish, the ticks get the
>>>>>>>>>>>> values
>>>>>>>>>>>> that i want (2nd image). I want always have the values like they
>>>>>>>>>>>> are shown
>>>>>>>>>>>> on second image, even during the animation.
>>>>>>>>>>>> Its that possible? Any idea i can i change this behavior?
>>>>>>>>>>>>
>>>>>>>>>>>> Thank you very much for be trying to help!
>>>>>>>>>>>> Regards,
>>>>>>>>>>>>
>>>>>>>>>>>> terça-feira, 18 de Outubro de 2016 às 15:38:18 UTC+1, Daniel
>>>>>>>>>>>> LaLiberte escreveu:
>>>>>>>>>>>>>
>>>>>>>>>>>>> Hi Ricky,
>>>>>>>>>>>>>
>>>>>>>>>>>>> Check this example out that reproduces your problem:
>>>>>>>>>>>>> https://jsfiddle.net/dlaliberte/wctwnro5/
>>>>>>>>>>>>> Then uncomment the viewWindow line and you will see that it
>>>>>>>>>>>>> does work correctly.
>>>>>>>>>>>>>
>>>>>>>>>>>>> On Tue, Oct 18, 2016 at 3:59 AM, Ricky Costa <
>>>>>>>>>>>>> [email protected]> wrote:
>>>>>>>>>>>>>
>>>>>>>>>>>>>> Hey Daniel,
>>>>>>>>>>>>>>
>>>>>>>>>>>>>> Thank you for your answer.
>>>>>>>>>>>>>>
>>>>>>>>>>>>>> If i apply my original values and don´t revert the direction,
>>>>>>>>>>>>>> this issue don´t happen. So i don´t think that the problem its
>>>>>>>>>>>>>> not enough
>>>>>>>>>>>>>> space :/. Its weird because this only happens when i change the
>>>>>>>>>>>>>> direction
>>>>>>>>>>>>>> of the bars!
>>>>>>>>>>>>>>
>>>>>>>>>>>>>> Regards,
>>>>>>>>>>>>>>
>>>>>>>>>>>>>> segunda-feira, 17 de Outubro de 2016 às 15:21:54 UTC+1,
>>>>>>>>>>>>>> Daniel LaLiberte escreveu:
>>>>>>>>>>>>>>>
>>>>>>>>>>>>>>> Hi Ricky,
>>>>>>>>>>>>>>>
>>>>>>>>>>>>>>> It appears the annotation for the top bar is dropped down,
>>>>>>>>>>>>>>> erroneously, perhaps because the code thinks it is too close to
>>>>>>>>>>>>>>> the top.
>>>>>>>>>>>>>>> Maybe arrange that there is more space on the top by using a
>>>>>>>>>>>>>>> vAxis.viewWindow.max of, say, 8000.
>>>>>>>>>>>>>>>
>>>>>>>>>>>>>>> On Mon, Oct 17, 2016 at 7:50 AM, Ricky Costa <
>>>>>>>>>>>>>>> [email protected]> wrote:
>>>>>>>>>>>>>>>
>>>>>>>>>>>>>>>> Hello,
>>>>>>>>>>>>>>>>
>>>>>>>>>>>>>>>> I am working on some google charts. In one of those charts
>>>>>>>>>>>>>>>> i am using a Bar Chart. I have negative and positive values,
>>>>>>>>>>>>>>>> so i have bars
>>>>>>>>>>>>>>>> to the right (positive) and bars to the left (negative), but i
>>>>>>>>>>>>>>>> am having
>>>>>>>>>>>>>>>> the ticks with negative values for the left bars. So i decided
>>>>>>>>>>>>>>>> turn my
>>>>>>>>>>>>>>>> positive values to negative, my negative values to positive
>>>>>>>>>>>>>>>> and apply the
>>>>>>>>>>>>>>>> direction: -1 to get the bars to the correct direction and
>>>>>>>>>>>>>>>> without negative
>>>>>>>>>>>>>>>> ticks. But i am getting an issue with one of my
>>>>>>>>>>>>>>>> annotations...it appears in
>>>>>>>>>>>>>>>> the incorrect position. Its visible in the image. Any idea
>>>>>>>>>>>>>>>> what is going on
>>>>>>>>>>>>>>>> and how to fix it? Or a better solution for what i am trying
>>>>>>>>>>>>>>>> to do?
>>>>>>>>>>>>>>>>
>>>>>>>>>>>>>>>> Thanks,
>>>>>>>>>>>>>>>>
>>>>>>>>>>>>>>>>
>>>>>>>>>>>>>>>> <https://lh3.googleusercontent.com/-la6MaC5QjV4/WAS6nGqvALI/AAAAAAAAAOU/4VCmJcElWgoMSs-cQLTkWWCgPtHsUekNACLcB/s1600/annotationIssue.png>
>>>>>>>>>>>>>>>> Best regards for you all.
>>>>>>>>>>>>>>>>
>>>>>>>>>>>>>>>> --
>>>>>>>>>>>>>>>> You received this message because you are subscribed to the
>>>>>>>>>>>>>>>> Google Groups "Google Visualization API" group.
>>>>>>>>>>>>>>>> To unsubscribe from this group and stop receiving emails
>>>>>>>>>>>>>>>> from it, send an email to google-visualization-api+unsub
>>>>>>>>>>>>>>>> [email protected].
>>>>>>>>>>>>>>>> To post to this group, send email to
>>>>>>>>>>>>>>>> [email protected].
>>>>>>>>>>>>>>>> Visit this group at https://groups.google.com/grou
>>>>>>>>>>>>>>>> p/google-visualization-api.
>>>>>>>>>>>>>>>> To view this discussion on the web visit
>>>>>>>>>>>>>>>> https://groups.google.com/d/ms
>>>>>>>>>>>>>>>> gid/google-visualization-api/e
>>>>>>>>>>>>>>>> 6cd39f8-e820-4533-bf6b-1c5f4485d46b%40googlegroups.com
>>>>>>>>>>>>>>>> <https://groups.google.com/d/msgid/google-visualization-api/e6cd39f8-e820-4533-bf6b-1c5f4485d46b%40googlegroups.com?utm_medium=email&utm_source=footer>
>>>>>>>>>>>>>>>> .
>>>>>>>>>>>>>>>> For more options, visit https://groups.google.com/d/optout.
>>>>>>>>>>>>>>>>
>>>>>>>>>>>>>>>
>>>>>>>>>>>>>>>
>>>>>>>>>>>>>>>
>>>>>>>>>>>>>>> --
>>>>>>>>>>>>>>> Daniel LaLiberte
>>>>>>>>>>>>>>> <https://plus.google.com/100631381223468223275?prsrc=2>
>>>>>>>>>>>>>>> [email protected]   5CC, Cambridge MA
>>>>>>>>>>>>>>>
>>>>>>>>>>>>>> --
>>>>>>>>>>>>>> You received this message because you are subscribed to the
>>>>>>>>>>>>>> Google Groups "Google Visualization API" group.
>>>>>>>>>>>>>> To unsubscribe from this group and stop receiving emails from
>>>>>>>>>>>>>> it, send an email to google-visualization-api+unsub
>>>>>>>>>>>>>> [email protected].
>>>>>>>>>>>>>> To post to this group, send email to
>>>>>>>>>>>>>> [email protected].
>>>>>>>>>>>>>> Visit this group at https://groups.google.com/grou
>>>>>>>>>>>>>> p/google-visualization-api.
>>>>>>>>>>>>>> To view this discussion on the web visit
>>>>>>>>>>>>>> https://groups.google.com/d/msgid/google-visualization-api/7
>>>>>>>>>>>>>> 2bdc51f-9943-4afc-93b0-34daf8982cde%40googlegroups.com
>>>>>>>>>>>>>> <https://groups.google.com/d/msgid/google-visualization-api/72bdc51f-9943-4afc-93b0-34daf8982cde%40googlegroups.com?utm_medium=email&utm_source=footer>
>>>>>>>>>>>>>> .
>>>>>>>>>>>>>>
>>>>>>>>>>>>>> For more options, visit https://groups.google.com/d/optout.
>>>>>>>>>>>>>>
>>>>>>>>>>>>>
>>>>>>>>>>>>>
>>>>>>>>>>>>>
>>>>>>>>>>>>> --
>>>>>>>>>>>>> Daniel LaLiberte
>>>>>>>>>>>>> <https://plus.google.com/100631381223468223275?prsrc=2>
>>>>>>>>>>>>> [email protected]   5CC, Cambridge MA
>>>>>>>>>>>>>
>>>>>>>>>>>> --
>>>>>>>>>>>> You received this message because you are subscribed to the
>>>>>>>>>>>> Google Groups "Google Visualization API" group.
>>>>>>>>>>>> To unsubscribe from this group and stop receiving emails from
>>>>>>>>>>>> it, send an email to google-visualization-api+unsub
>>>>>>>>>>>> [email protected].
>>>>>>>>>>>> To post to this group, send email to
>>>>>>>>>>>> [email protected].
>>>>>>>>>>>> Visit this group at https://groups.google.com/grou
>>>>>>>>>>>> p/google-visualization-api.
>>>>>>>>>>>> To view this discussion on the web visit
>>>>>>>>>>>> https://groups.google.com/d/msgid/google-visualization-api/0
>>>>>>>>>>>> 8a55033-a5c2-44c7-babb-52c05986ddc6%40googlegroups.com
>>>>>>>>>>>> <https://groups.google.com/d/msgid/google-visualization-api/08a55033-a5c2-44c7-babb-52c05986ddc6%40googlegroups.com?utm_medium=email&utm_source=footer>
>>>>>>>>>>>> .
>>>>>>>>>>>>
>>>>>>>>>>>> For more options, visit https://groups.google.com/d/optout.
>>>>>>>>>>>>
>>>>>>>>>>>
>>>>>>>>>>>
>>>>>>>>>>>
>>>>>>>>>>> --
>>>>>>>>>>> Daniel LaLiberte
>>>>>>>>>>> <https://plus.google.com/100631381223468223275?prsrc=2>
>>>>>>>>>>> [email protected]   5CC, Cambridge MA
>>>>>>>>>>>
>>>>>>>>>> --
>>>>>>>>>> You received this message because you are subscribed to the
>>>>>>>>>> Google Groups "Google Visualization API" group.
>>>>>>>>>> To unsubscribe from this group and stop receiving emails from it,
>>>>>>>>>> send an email to google-visualization-api+unsub
>>>>>>>>>> [email protected].
>>>>>>>>>> To post to this group, send email to
>>>>>>>>>> [email protected].
>>>>>>>>>> Visit this group at https://groups.google.com/grou
>>>>>>>>>> p/google-visualization-api.
>>>>>>>>>> To view this discussion on the web visit
>>>>>>>>>> https://groups.google.com/d/msgid/google-visualization-api/2
>>>>>>>>>> 0edac1e-fafe-4c2e-bfcf-fd6de7e49747%40googlegroups.com
>>>>>>>>>> <https://groups.google.com/d/msgid/google-visualization-api/20edac1e-fafe-4c2e-bfcf-fd6de7e49747%40googlegroups.com?utm_medium=email&utm_source=footer>
>>>>>>>>>> .
>>>>>>>>>>
>>>>>>>>>> For more options, visit https://groups.google.com/d/optout.
>>>>>>>>>>
>>>>>>>>>
>>>>>>>>>
>>>>>>>>>
>>>>>>>>> --
>>>>>>>>> Daniel LaLiberte
>>>>>>>>> <https://plus.google.com/100631381223468223275?prsrc=2>
>>>>>>>>> [email protected]   5CC, Cambridge MA
>>>>>>>>>
>>>>>>>> --
>>>>>>> You received this message because you are subscribed to the Google
>>>>>>> Groups "Google Visualization API" group.
>>>>>>> To unsubscribe from this group and stop receiving emails from it,
>>>>>>> send an email to google-visualization-api+unsub
>>>>>>> [email protected].
>>>>>>> To post to this group, send email to [email protected]
>>>>>>> om.
>>>>>>> Visit this group at https://groups.google.com/grou
>>>>>>> p/google-visualization-api.
>>>>>>> To view this discussion on the web visit
>>>>>>> https://groups.google.com/d/msgid/google-visualization-api/4
>>>>>>> f70e91e-d3a7-4466-9960-d91081ec0d5b%40googlegroups.com
>>>>>>> <https://groups.google.com/d/msgid/google-visualization-api/4f70e91e-d3a7-4466-9960-d91081ec0d5b%40googlegroups.com?utm_medium=email&utm_source=footer>
>>>>>>> .
>>>>>>>
>>>>>>> For more options, visit https://groups.google.com/d/optout.
>>>>>>>
>>>>>>
>>>>>>
>>>>>>
>>>>>> --
>>>>>> Daniel LaLiberte
>>>>>> <https://plus.google.com/100631381223468223275?prsrc=2>
>>>>>> [email protected]   5CC, Cambridge MA
>>>>>>
>>>>> --
>>> You received this message because you are subscribed to a topic in the
>>> Google Groups "Google Visualization API" group.
>>> To unsubscribe from this topic, visit https://groups.google.com/d/to
>>> pic/google-visualization-api/XFC07Adkoc8/unsubscribe.
>>> To unsubscribe from this group and all its topics, send an email to
>>> [email protected].
>>> To post to this group, send email to google-visualization-api@googl
>>> egroups.com.
>>> Visit this group at https://groups.google.com/grou
>>> p/google-visualization-api.
>>> To view this discussion on the web visit https://groups.google.com/d/ms
>>> gid/google-visualization-api/d78ed79a-aefe-4035-93e3-d758cb9
>>> 48650%40googlegroups.com
>>> <https://groups.google.com/d/msgid/google-visualization-api/d78ed79a-aefe-4035-93e3-d758cb948650%40googlegroups.com?utm_medium=email&utm_source=footer>
>>> .
>>>
>>> For more options, visit https://groups.google.com/d/optout.
>>>
>>
>>
>>
>> --
>> Ricardo Costa
>>
>> --
>> You received this message because you are subscribed to the Google Groups
>> "Google Visualization API" group.
>> To unsubscribe from this group and stop receiving emails from it, send an
>> email to [email protected].
>> To post to this group, send email to google-visualization-api@googl
>> egroups.com.
>> Visit this group at https://groups.google.com/grou
>> p/google-visualization-api.
>> To view this discussion on the web visit https://groups.google.com/d/ms
>> gid/google-visualization-api/CAGab5V2sRXcc0TJbBHgAe8_kprSQD
>> f2Zd9e7vLu%3DgBKVPrVC0A%40mail.gmail.com
>> <https://groups.google.com/d/msgid/google-visualization-api/CAGab5V2sRXcc0TJbBHgAe8_kprSQDf2Zd9e7vLu%3DgBKVPrVC0A%40mail.gmail.com?utm_medium=email&utm_source=footer>
>> .
>>
>> For more options, visit https://groups.google.com/d/optout.
>>
>
>
>
> --
> Daniel LaLiberte <https://plus.google.com/100631381223468223275?prsrc=2>
> [email protected] <[email protected]>   5CC, Cambridge MA
>
> --
> You received this message because you are subscribed to a topic in the
> Google Groups "Google Visualization API" group.
> To unsubscribe from this topic, visit https://groups.google.com/d/
> topic/google-visualization-api/XFC07Adkoc8/unsubscribe.
> To unsubscribe from this group and all its topics, send an email to
> [email protected].
> To post to this group, send email to google-visualization-api@
> googlegroups.com.
> Visit this group at https://groups.google.com/
> group/google-visualization-api.
> To view this discussion on the web visit https://groups.google.com/d/
> msgid/google-visualization-api/CAOtcSJNmM%2BDVW-Jpb%
> 3DcjhsqBHbKe37Uapr3gSAmx0rELmfgCdA%40mail.gmail.com
> <https://groups.google.com/d/msgid/google-visualization-api/CAOtcSJNmM%2BDVW-Jpb%3DcjhsqBHbKe37Uapr3gSAmx0rELmfgCdA%40mail.gmail.com?utm_medium=email&utm_source=footer>
> .
>
> For more options, visit https://groups.google.com/d/optout.
>


--
Ricardo Costa

--
You received this message because you are subscribed to the Google Groups
"Google Visualization API" group.
To unsubscribe from this group and stop receiving emails from it, send an email
to [email protected].
To post to this group, send email to [email protected].
Visit this group at https://groups.google.com/group/google-visualization-api.
To view this discussion on the web visit
https://groups.google.com/d/msgid/google-visualization-api/CAGab5V0t%3DQxJ5a2uSj%2BvcAqTsvyyHUUxN2ojC0tPydsufzF0wA%40mail.gmail.com.
For more options, visit https://groups.google.com/d/optout.