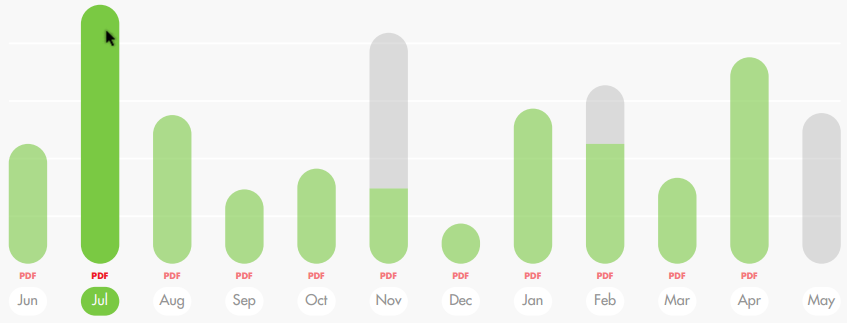
Hello,

I need to add html to column cells in order to change the apearence of the
columns (Jun, Jul, Ago) of the below chart from this:
<https://lh3.googleusercontent.com/-zBRAXter2dA/WT62f7_LtOI/AAAAAAAAA2M/kF16OdW9l3UG4cj8Pq8xJ1iyiQQgnnpSQCLcB/s1600/chart.PNG>


to this:


<https://lh3.googleusercontent.com/-1ip0Ms2isTs/WT63qBcJDQI/AAAAAAAAA2U/AJv0XfROb_QHKtI7lYxIprGw5BXwtUhPgCLcB/s1600/chart2.PNG>


(i.e., I need to change the apearance of name of the months and to include
a PDF link above each month).


I could not find how html to charts in the documentation, only to tables. I
tried to use the option "allowHtml: true" but without success; it looks
like this option it is only available to tables.


I found some partial solutions online to this problem but they have several
year, so I wonder if the API has evolved to allow html on charts. Is this
possible to do?


Looking forward to know your suggestions, Thanks!


--
You received this message because you are subscribed to the Google Groups
"Google Visualization API" group.
To unsubscribe from this group and stop receiving emails from it, send an email
to [email protected].
To post to this group, send email to [email protected].
Visit this group at https://groups.google.com/group/google-visualization-api.
To view this discussion on the web visit
https://groups.google.com/d/msgid/google-visualization-api/d1045ef7-8b65-4315-92c9-675355ac4aa2%40googlegroups.com.
For more options, visit https://groups.google.com/d/optout.