I want to create a MTD against target line chart but I'm not sure it is
actually possible to do it the way I want - hoping I can be proven wrong.
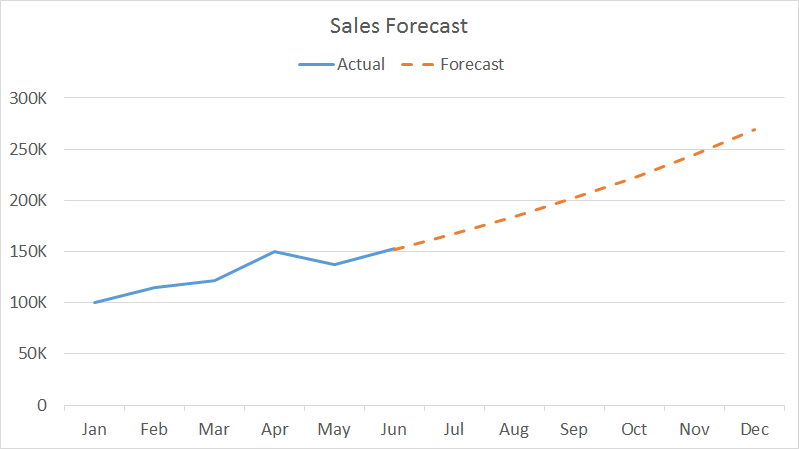
Line 1: Accumulative Daily Target - e.g. solid red line
Line 2.1: Accumulative Daily MTD (up until last night) - e.g. solid blue
line
Line 2.2: Accumulative Daily Forecast MTD (from today til end of month) -
e.g. dotted blue line

Effectively I want the MTD line to change from a solid line to a dotted
line before/after "today" e.e.
https://exceljet.net/sites/default/files/images/chart/line%20chart%20actual%20with%20forecast.png
 (But
with the target line added)

--
You received this message because you are subscribed to the Google Groups
"Google Visualization API" group.
To unsubscribe from this group and stop receiving emails from it, send an email
to [email protected].
To view this discussion on the web visit
https://groups.google.com/d/msgid/google-visualization-api/79b3eb90-7bef-4a02-96d9-955ac77b6da1%40googlegroups.com.