Hi there,

does anyone know if there is a way to control the vertical (or even
horizontal) position of nodes in a Sankey diagram? Right now, it
'automatically' positions nodes in a specific way, and I'm trying to have a
specific order of nodes to maintain consistency.
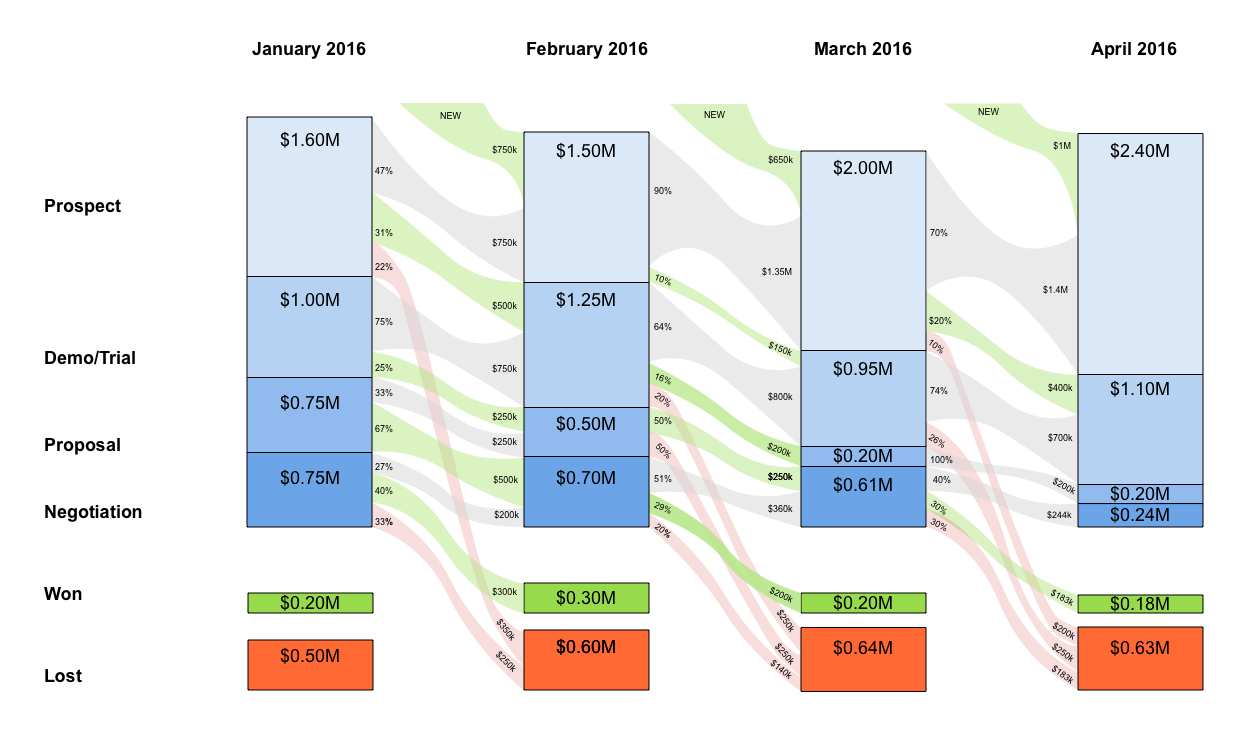
Concretely, I'm using the Sankey chart to display the flow of 'things'
through a process over time, and for each interval, I want the nodes to
have the same order.

Is that at all possible using Google charts, and if not, does anyone know
of a Sankey or similar diagram that would allow for this? For reference,
the kind of diagram I'm trying to create should be as close an
approximation as possible to this sales pipeline chart:
https://3.bp.blogspot.com/-UJnsdS6VkkE/V28OMpE3v5I/AAAAAAAAAgM/I3dw_T9FmIsiCrxbbGeHqc81M5ZlZ8VnQCLcB/s1600/PipelineVizStep2.png

--
You received this message because you are subscribed to the Google Groups
"Google Visualization API" group.
To unsubscribe from this group and stop receiving emails from it, send an email
to [email protected].
To view this discussion on the web visit
https://groups.google.com/d/msgid/google-visualization-api/14a1ffea-617a-4dc1-bb7a-9b9f02e331b6%40googlegroups.com.