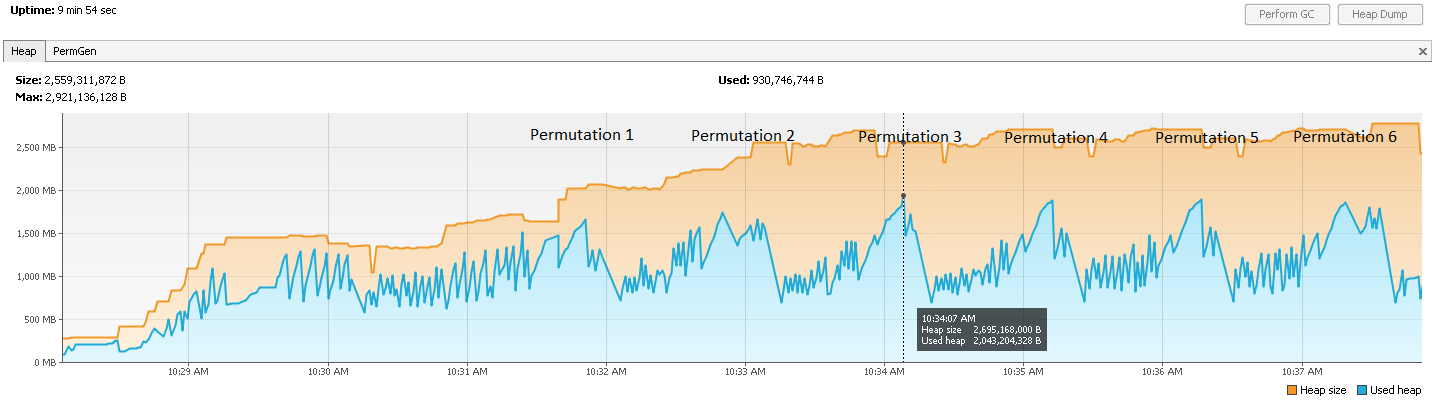
Hi,

The following is the memory graph from JVisualVM of the GWT compiler when
compiling my modules.
<https://lh5.googleusercontent.com/-108riwJnhYo/Uc1T1fmyn9I/AAAAAAAAAC8/DisMhsEbbg8/s1436/GWTCompilerMemory1.png>


I was trying to understand the memory consumption at different stages of
the compiler using the VM argument - -Dgwt.memory.usage.
The following is the JVisualVM graph and the console output when the
compiler is run with the same.

<https://lh4.googleusercontent.com/-dV8t7dsIhrE/Uc1RVq0MXuI/AAAAAAAAACs/Rxby6Jt6ME0/s1435/GWTCompilerMemory.png>


Will print mem usage

Compiling module XXX

[CompStateBuilt]         320804120 heap,   21314504 nonheap,  342118624
total,      23.21s

[AstOnly]                       604512808 heap,   42120632 nonheap,
646633440 total,      38.71s

   Compiling 6 permutations

      Compiling permutation 0...

[makeSoycArtifactsS]  754570192 heap,   50642360 nonheap,  805212552
total,     103.22s

      Compiling permutation 1...

[makeSoycArtifactsS]  737860952 heap,   51196480 nonheap,  789057432
total,      55.79s

      Compiling permutation 2...

[makeSoycArtifactsS]  737125848 heap,   51479208 nonheap,  788605056
total,      56.86s

      Compiling permutation 3...

[makeSoycArtifactsS]  736970808 heap,   51584272 nonheap,  788555080
total,      57.11s

      Compiling permutation 4...

[makeSoycArtifactsS]  737455120 heap,   51679488 nonheap,  789134608
total,      55.08s

      Compiling permutation 5...

[makeSoycArtifactsS]  737228448 heap,   51688424 nonheap,  788916872
total,      54.64s

   Compile of permutations succeeded

Linking into xxxxxxx

   Link succeeded

   Compilation succeeded -- 498.726s


As you can see, the graph is different when run with the -Dgwt.memory.usage
option.
When this argument is specified,  at the end of each permutation
System.gc() gets called 4 times by
com.google.gwt.dev.util.Memory.maybeDumpMemory()
and then prints the memory statistics in the console[makeSoycArtifactsS] .
Because of these garbage collection calls, the heap size gets reduced to
around 750 MB. Basically during each permutation compile, the memory goes
up while building the permutation and goes to a low while printing the
output.


Now, if you see the first graph, which is obtained without this option, the
heap size does not come down after each permutation compile, so the overall
memory required goes up for the last 2/3 permutations(There is a difference
of ~450MB) .


I also looked at what is causing the memory to jump during each permutation
compilation by taking a heap dump at one of the peaks and comparing it to
the heapdump at the AstOnly stage. The comparison showed that most of the
memory is taken up by HashMap.Entry objects which contain JMethod,JField
etc.. Most of these HashMaps are referenced by *
com.google.gwt.dev.jjs.impl.ControlFlowAnalyzer.RescueVisitor* .


I have the following questions


   - Should GWT be calling System.gc() by default after each permutation
   compile so that the heap does not grow? (Right now it does that only with
   the -Dgwt.memory.usage option)
   - The memory growth due to RescueVisitor, can this be due to including
   modules which are not required? Is there a way to find out the classes that
   are pruned by the compiler. Can there be any other optimization we can do
   to reduce this memory growth?

Right now there are only 20 modules in my application, that number is going
to grow significantly going ahead and that's the reason we are doing this
analysis to understand what can be done to reduce this memory growth.

Thanks,
Ranjith


--
You received this message because you are subscribed to the Google Groups
"Google Web Toolkit" group.
To unsubscribe from this group and stop receiving emails from it, send an email
to [email protected].
To post to this group, send email to [email protected].
Visit this group at http://groups.google.com/group/google-web-toolkit.
For more options, visit https://groups.google.com/groups/opt_out.