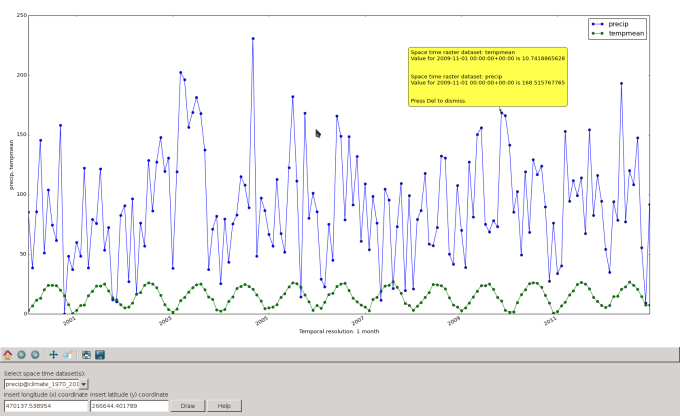
On Thu, Jun 26, 2014 at 3:52 PM, Luca Delucchi <[email protected]> wrote:
> Hi everybody,
>
> I just commit in trunk (r60981) a new tool for wxgui, the Temporal plot.
> It allows the user to see in a plot the values of one or more temporal
> datasets (strds, stvds,
> str3ds) for a queried point defined by a coordinate pair, it can also
> save directly the plot to an image (so it is possible to run it on a
> script for several point).
nice work, Luca (and thanks to Anna for code cleanup).

Here the obligatory screenshot made by Luca:
http://svn.osgeo.org/grass/grass/trunk/gui/wxpython/tplot/tplot.png

> Testing and improvement are really welcome.

thanks
Markus

> --
> ciao
> Luca
>
> http://gis.cri.fmach.it/delucchi/
> www.lucadelu.org
> _______________________________________________
> grass-dev mailing list
> [email protected]
> http://lists.osgeo.org/mailman/listinfo/grass-dev
_______________________________________________
grass-dev mailing list
[email protected]
http://lists.osgeo.org/mailman/listinfo/grass-dev