Hi Patricia,

On Tue, Jun 6, 2017 at 9:16 PM, Szalona P <[email protected]> wrote:
> Hello :D My name is Patricia and need help with GRASS. Will be visible if you
> help me find some information about the GRASS operation:D
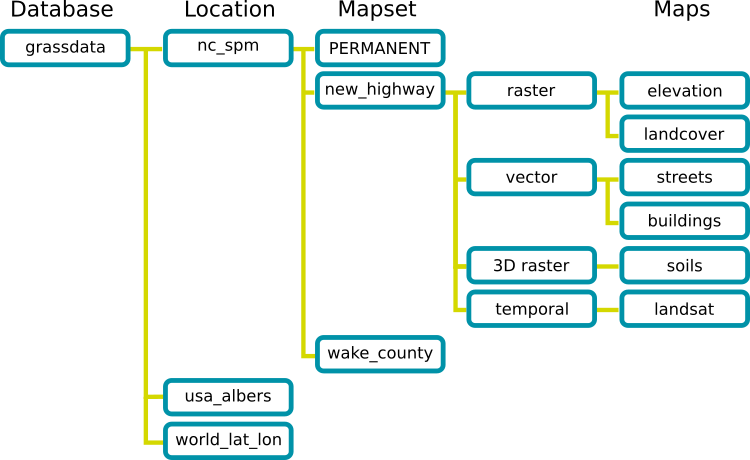
Much is covered here:
https://grass.osgeo.org/grass72/manuals/index.html

and nice tutorials are here:
https://grass.osgeo.org/documentation/tutorials/

> So I need to know :
> 1.What is the proper sequence of the basic elements of the GRASS
> hierarchical data structure?

You can find that here in a graphical view:

https://svn.osgeo.org/grass/grass/trunk/doc/grass_database.png

and more detailed here:
https://grass.osgeo.org/grass72/manuals/helptext.html#2.-background:-grass-gis-location-structure


> 2.Does g.region have mandatory parameters? If yes, then specify what ?

In general no, it can run with a single flag like "-p" for print the
current region.
See
https://grass.osgeo.org/grass72/manuals/g.region.html


> 3.To open multiple graphical monitors, command line mode allows the GRASS
> system ?

You can use
d.mon wx0

see
https://grass.osgeo.org/grass72/manuals/d.mon.html

> 4.What is the full (obligatory) syntax of a command that allows you to
> display basic GRASS layer information?

d.rast rastermap
d.vect vectormap

> 5.How do you know the parameters of a region assigned to a raster layer
> called powiats? Enter a command or command to let you know.

g.region raster=powiats -p

> 6.The command syntax along with the appropriate parameter to display the
> vector layers available in the system?

g.list vector

> 7.Command name and its mandatory parameters to display a composite image
> composed of three RGB color channels. Layer names can be fictitious

d.rgb ... :-)

> 8After changing the working area (computational), this information should be
> passed to the graphical command line mode window. Give commands that you can
> use

d.erase

> 9.To test how many pixels in the raster layer have a given average value,
> use the command
> Along with the parameters (flags):

There are different possibilities, eg with r.mapcalc or r.stats or others.

> 10.
> Write the command syntax along with the formula (raster map calculator),
> which will give you a new raster floating point class, called alpha, as a
> result of the formula calculation:
> alfa=(2⋅sin(srednia"\_"beta))/3

Similar to what you wrote but be sure to have white space left and
right from the " = " sign.

> 11
> Write a command syntax that will allow you to calculate the TVI vegetative
> index. The input layers are landsat_band3 and landsat_band4.
> TVI=√((NDVI+0.5) )

Check i.vi and r.mapcalc.

> I  really needs help because nobody at all does not want to give me any
> information:/

HTH,
Markus

--
Markus Neteler, PhD
http://www.mundialis.de - free data with free software
http://grass.osgeo.org
http://courses.neteler.org/blog
_______________________________________________
grass-user mailing list
[email protected]
https://lists.osgeo.org/mailman/listinfo/grass-user