    [
https://issues.apache.org/jira/browse/DRILL-6289?page=com.atlassian.jira.plugin.system.issuetabpanels:comment-tabpanel&focusedCommentId=16439987#comment-16439987
 ]
ASF GitHub Bot commented on DRILL-6289:
---------------------------------------
Github user kkhatua commented on the issue:
https://github.com/apache/drill/pull/1203
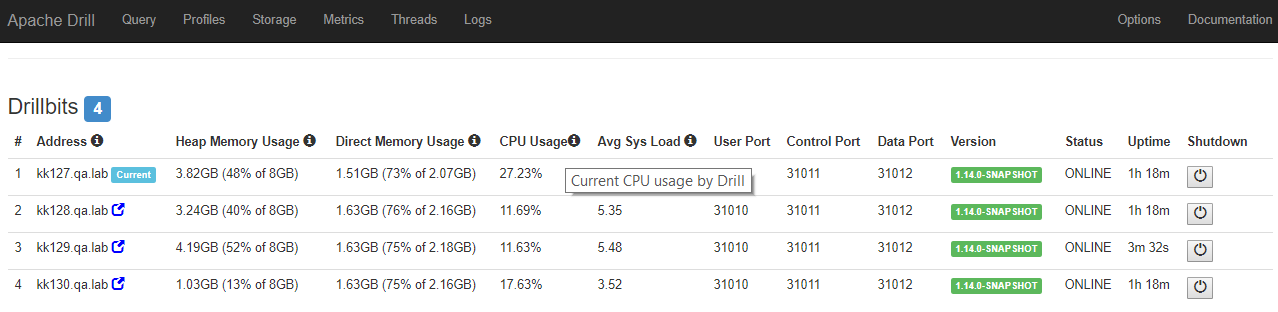
Updated with an additional set of changes.
* Added CPU metrics (obtained from
[OperatingSystemMXBean.getProcessCpuLoad()](https://docs.oracle.com/javase/7/docs/jre/api/management/extension/com/sun/management/OperatingSystemMXBean.html#getProcessCpuLoad())
)
* Added uptime information so that you know if a Drillbit ever has a
different start time.
* Grey-out a button (disabled, i.e.) if the node is offline or remote &
requires HTTPS
* Additional changes based on comments
Screenshot
> Cluster view should show more relevant information
> --------------------------------------------------
>
> Key: DRILL-6289
> URL: https://issues.apache.org/jira/browse/DRILL-6289
> Project: Apache Drill
> Issue Type: Improvement
> Components: Web Server
> Affects Versions: 1.13.0
> Reporter: Kunal Khatua
> Assignee: Kunal Khatua
> Priority: Major
> Fix For: 1.14.0
>
> Original Estimate: 168h
> Remaining Estimate: 168h
>
> When fixing DRILL-6224, I noticed that the same information can be very
> useful to have in the cluster view shown on a Drillbit's homepage.
> The proposal is to show the following:
> # Heap Memory in use
> # Direct Memory (actively) in use - Since we're not able to get the total
> memory held by Netty at the moment, but only what is currently allocated to
> running queries
> # Process CPU
> # Average (System) Load Factor
> Information such as the port numbers don't help much during general cluster
> health, so it might be worth removing this information if more real-estate is
> needed.
--
This message was sent by Atlassian JIRA
(v7.6.3#76005)