    [
https://issues.apache.org/jira/browse/FLINK-16267?page=com.atlassian.jira.plugin.system.issuetabpanels:comment-tabpanel&focusedCommentId=17049548#comment-17049548
 ]
Yun Tang edited comment on FLINK-16267 at 3/3/20 2:01 AM:
----------------------------------------------------------
Hi [~czchen], I suspect the memory consumed by iterator over map state is the
cause lead to the OOM as that memory is not controllable. But before I give
analysis for you problem, I hope you could provide more information.
* How many slots you have for one task manager? Since you only have one
KeyedProcessFunction with 4 states, I believe there would be only one RocksDB
instance in one slot. I need to know how many slots for one task manager, if
one TM has 4 slots and each would be used by a sub-task of
KeyedProcessFunction, then that TM would have 4 RocksDB instances.
* Have you ever configured RocksDB related pre-defined options or customized
options factory?
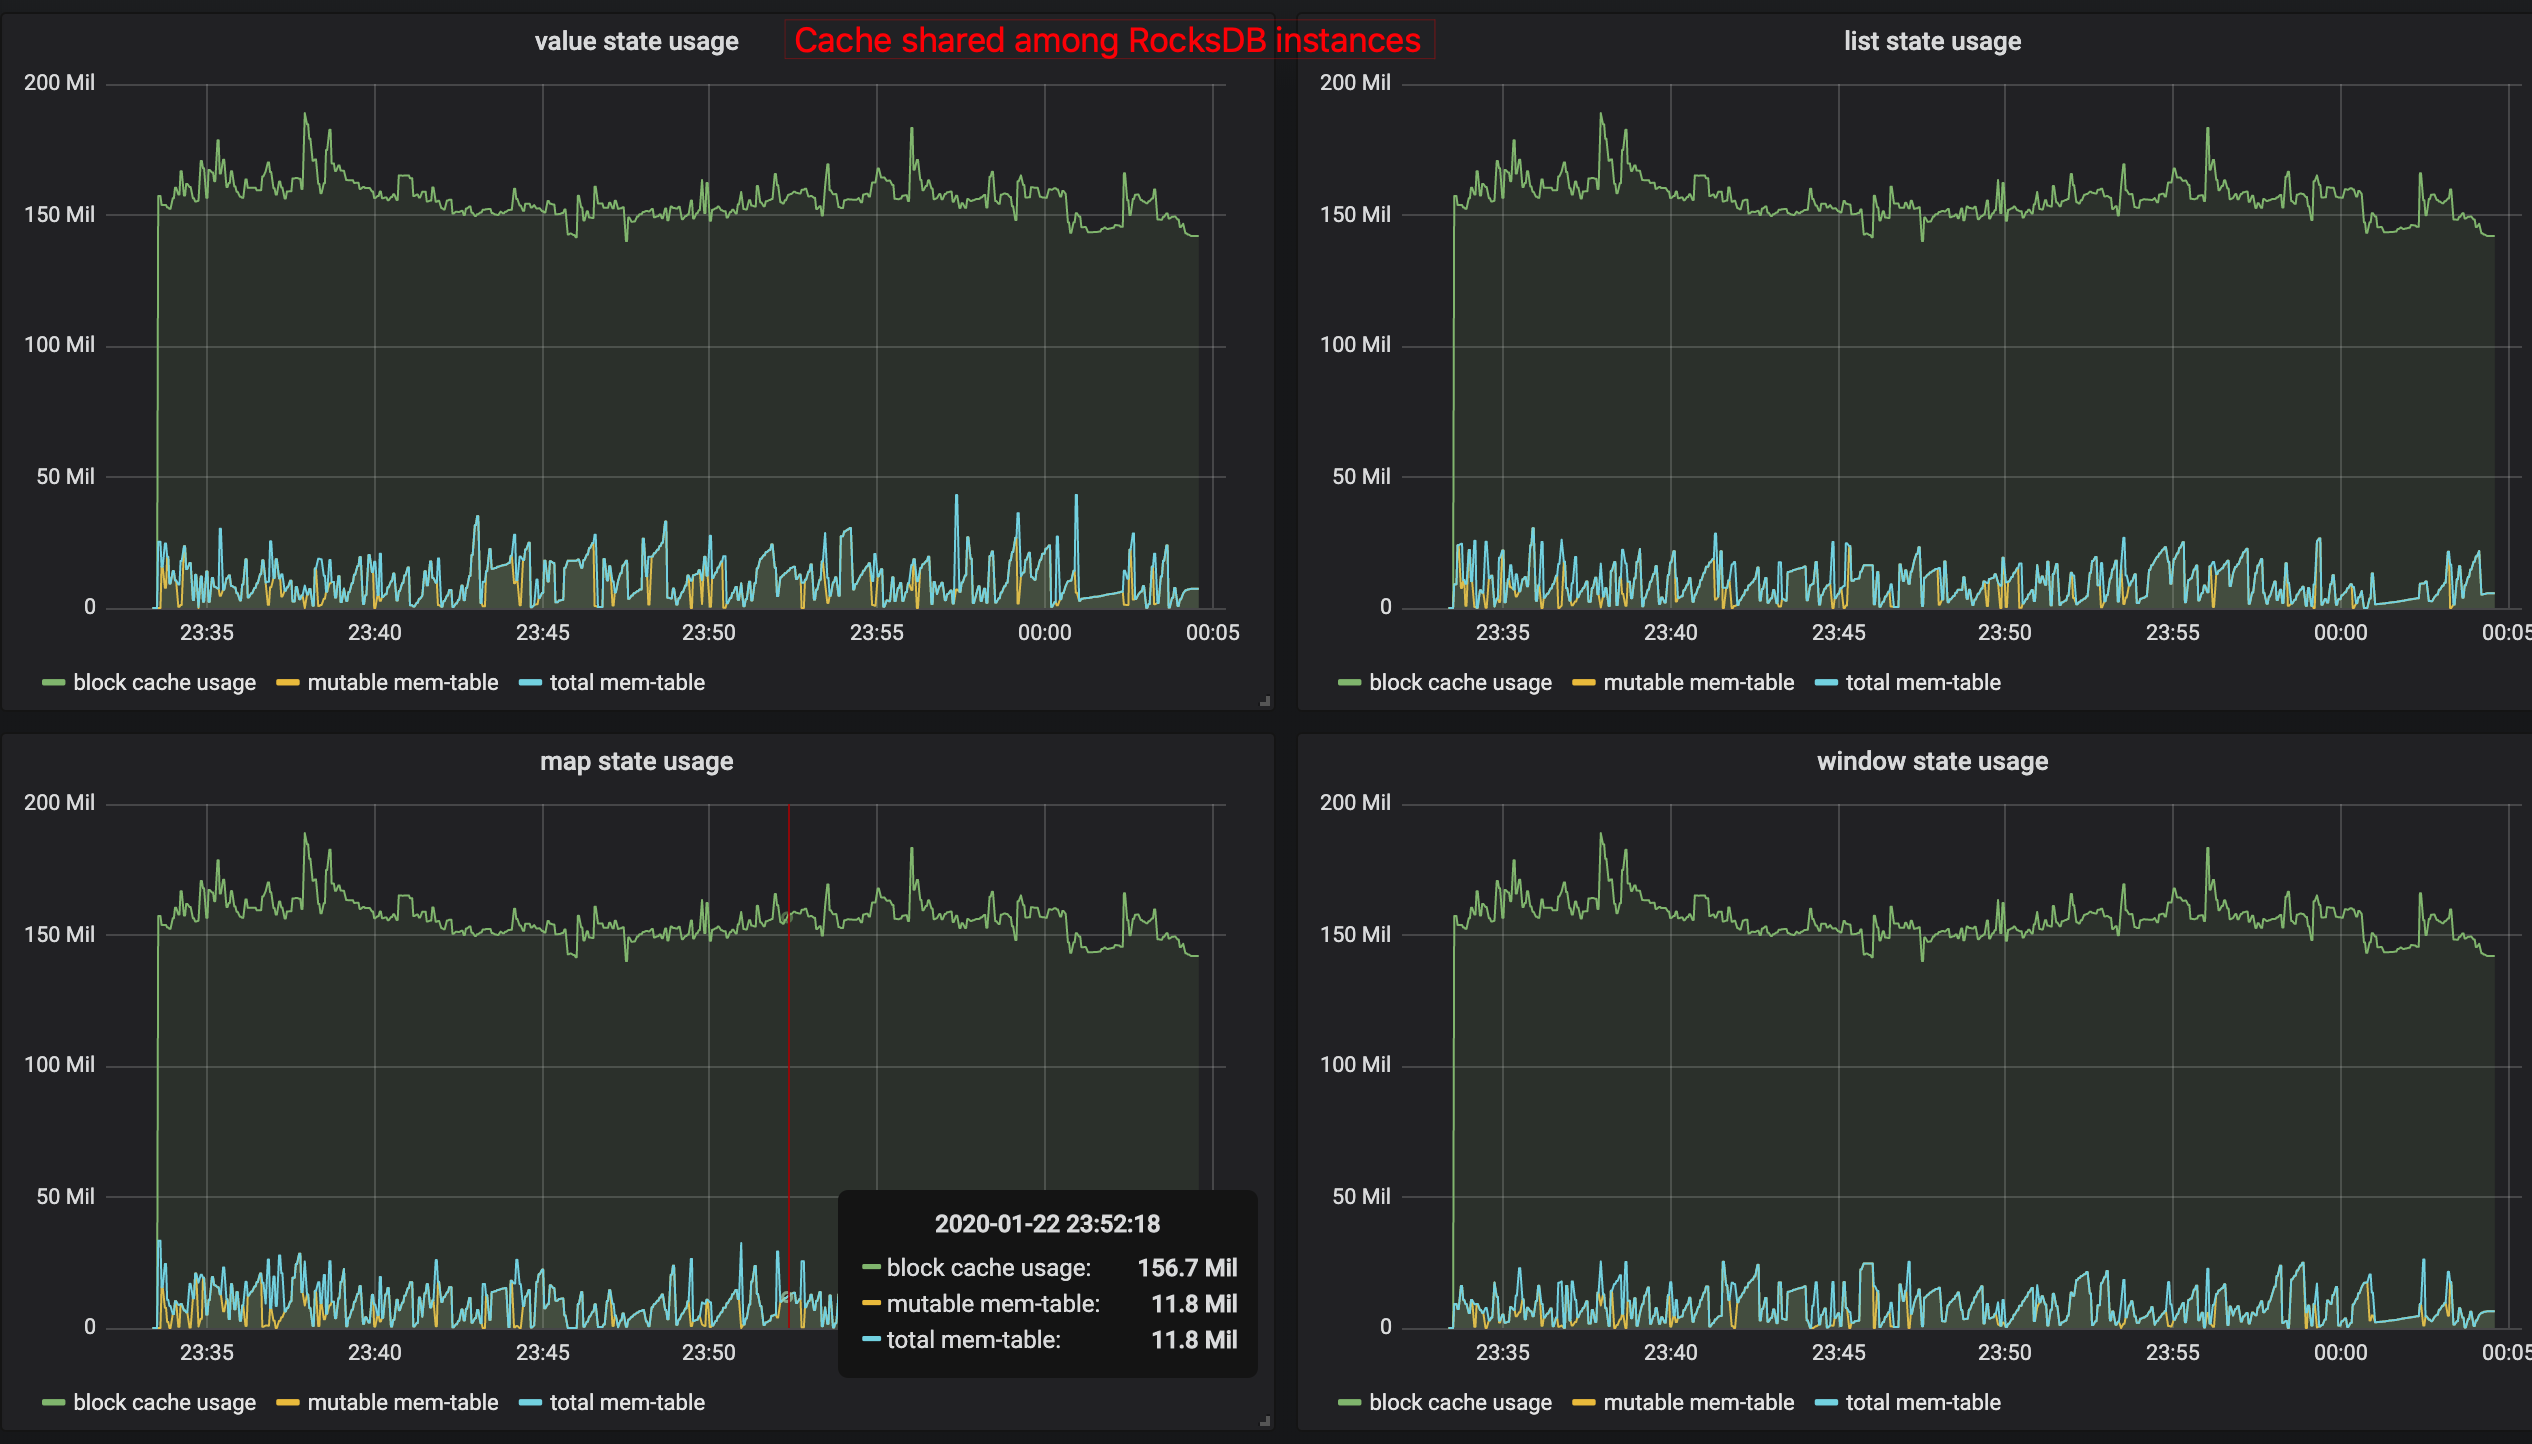
* More RocksDB related metrics could help more. You could refer to
[PR-10930|https://github.com/apache/flink/pull/10930] to view the metrics shown
for memory usage in RocksDB. [Memory control via sharing
cache|https://user-images.githubusercontent.com/1709104/72965622-ce904800-3df7-11ea-8a04-b818f67929c4.png]
VS [No memory control for
RocksDB|https://user-images.githubusercontent.com/1709104/72965622-ce904800-3df7-11ea-8a04-b818f67929c4.png]
** When you manage memory for RocksDB, you would only need to view the block
cache usage to turn on configuration
{{state.backend.rocksdb.metrics.block-cache-usage: true}}, and the metrics
name could be
{{taskmanager_job_task_operator_\{state-name}_rocksdb.block-cache-usage}}. Due
to different slots share the same cache, the block-cache-usage in metrics is
the same for different states at that specific sub-task, as you can see from
the picture from the PR.
** When you did not manage memory for RocksDB, you need to turn on
*** {{state.backend.rocksdb.metrics.block-cache-usage: true}}
*** {{state.backend.rocksdb.metrics.size-all-mem-tables: true}} , and the
metrics name could be
{{taskmanager_job_task_operator_\{state-name}_rocksdb.size-all-mem-tables}}
You need to add {{block-cache-usage}} and {{size-all-mem-tables}} of all
states with different \{{ {state-name}
}} at the same sub-task-index to know how much memory used, as you can see from
the picture in the PR.
was (Author: yunta):
Hi [~czchen], I suspect the memory consumed by iterator over map state is the
cause lead to the OOM as that memory is not controllable. But before I give
analysis for you problem, I hope you could provide more information.
* How many slots you have for one task manager? Since you only have one
KeyedProcessFunction with 4 states, I believe there would be only one RocksDB
instance in one slot. I need to know how many slots for one task manager, if
one TM has 4 slots and each would be used by a sub-task of
KeyedProcessFunction, then that TM would have 4 RocksDB instances.
* More RocksDB related metrics could help more. You could refer to
[PR-10930|https://github.com/apache/flink/pull/10930] to view the metrics shown
for memory usage in RocksDB. [Memory control via sharing
cache|https://user-images.githubusercontent.com/1709104/72965622-ce904800-3df7-11ea-8a04-b818f67929c4.png]
VS [No memory control for
RocksDB|https://user-images.githubusercontent.com/1709104/72965622-ce904800-3df7-11ea-8a04-b818f67929c4.png]
** When you manage memory for RocksDB, you would only need to view the block
cache usage to turn on configuration
{{state.backend.rocksdb.metrics.block-cache-usage: true}}, and the metrics
name could be
{{taskmanager_job_task_operator_\{state-name}_rocksdb.block-cache-usage}}. Due
to different slots share the same cache, the block-cache-usage in metrics is
the same for different states at that specific sub-task, as you can see from
the picture from the PR.
** When you did not manage memory for RocksDB, you need to turn on
*** {{state.backend.rocksdb.metrics.block-cache-usage: true}}
*** {{state.backend.rocksdb.metrics.size-all-mem-tables: true}} , and the
metrics name could be
{{taskmanager_job_task_operator_\{state-name}_rocksdb.size-all-mem-tables}}
You need to add {{block-cache-usage}} and {{size-all-mem-tables}} of all
states with different {{{state-name}}} at the same sub-task-index to know how
much memory used, as you can see from the picture in the PR.
> Flink uses more memory than taskmanager.memory.process.size in Kubernetes
> -------------------------------------------------------------------------
>
> Key: FLINK-16267
> URL: https://issues.apache.org/jira/browse/FLINK-16267
> Project: Flink
> Issue Type: Bug
> Components: Runtime / Task
> Affects Versions: 1.10.0
> Reporter: ChangZhuo Chen (陳昌倬)
> Priority: Major
> Attachments: flink-conf_1.10.0.yaml, flink-conf_1.9.1.yaml,
> oomkilled_taskmanager.log
>
>
> This issue is from
> [https://stackoverflow.com/questions/60336764/flink-uses-more-memory-than-taskmanager-memory-process-size-in-kubernetes]
> h1. Description
> * In Flink 1.10.0, we try to use `taskmanager.memory.process.size` to limit
> the resource used by taskmanager to ensure they are not killed by Kubernetes.
> However, we still get lots of taskmanager `OOMKilled`. The setup is in the
> following section.
> * The taskmanager log is in attachment [^oomkilled_taskmanager.log].
> h2. Kubernete
> * The Kubernetes setup is the same as described in
> [https://ci.apache.org/projects/flink/flink-docs-release-1.10/ops/deployment/kubernetes.html].
> * The following is resource configuration for taskmanager deployment in
> Kubernetes:
> {{resources:}}
> {{ requests:}}
> {{ cpu: 1000m}}
> {{ memory: 4096Mi}}
> {{ limits:}}
> {{ cpu: 1000m}}
> {{ memory: 4096Mi}}
> h2. Flink Docker
> * The Flink docker is built by the following Docker file.
> {{FROM flink:1.10-scala_2.11}}
> RUN mkdir -p /opt/flink/plugins/s3 &&
> ln -s /opt/flink/opt/flink-s3-fs-presto-1.10.0.jar /opt/flink/plugins/s3/
> {{RUN ln -s /opt/flink/opt/flink-metrics-prometheus-1.10.0.jar
> /opt/flink/lib/}}
> h2. Flink Configuration
> * The following are all memory related configurations in `flink-conf.yaml`
> in 1.10.0:
> {{jobmanager.heap.size: 820m}}
> {{taskmanager.memory.jvm-metaspace.size: 128m}}
> {{taskmanager.memory.process.size: 4096m}}
> * We use RocksDB and we don't set `state.backend.rocksdb.memory.managed` in
> `flink-conf.yaml`.
> ** Use S3 as checkpoint storage.
> * The code uses DateStream API
> ** input/output are both Kafka.
> h2. Project Dependencies
> * The following is our dependencies.
> {{val flinkVersion = "1.10.0"}}{{libraryDependencies +=
> "com.squareup.okhttp3" % "okhttp" % "4.2.2"}}
> {{libraryDependencies += "com.typesafe" % "config" % "1.4.0"}}
> {{libraryDependencies += "joda-time" % "joda-time" % "2.10.5"}}
> {{libraryDependencies += "org.apache.flink" %% "flink-connector-kafka" %
> flinkVersion}}
> {{libraryDependencies += "org.apache.flink" % "flink-metrics-dropwizard" %
> flinkVersion}}
> {{libraryDependencies += "org.apache.flink" %% "flink-scala" % flinkVersion
> % "provided"}}
> {{libraryDependencies += "org.apache.flink" %% "flink-statebackend-rocksdb"
> % flinkVersion % "provided"}}
> {{libraryDependencies += "org.apache.flink" %% "flink-streaming-scala" %
> flinkVersion % "provided"}}
> {{libraryDependencies += "org.json4s" %% "json4s-jackson" % "3.6.7"}}
> {{libraryDependencies += "org.log4s" %% "log4s" % "1.8.2"}}
> {{libraryDependencies += "org.rogach" %% "scallop" % "3.3.1"}}
> h2. Previous Flink 1.9.1 Configuration
> * The configuration we used in Flink 1.9.1 are the following. It does not
> have `OOMKilled`.
> h3. Kubernetes
> {{resources:}}
> {{ requests:}}
> {{ cpu: 1200m}}
> {{ memory: 2G}}
> {{ limits:}}
> {{ cpu: 1500m}}
> {{ memory: 2G}}
> h3. Flink 1.9.1
> {{jobmanager.heap.size: 820m}}
> {{taskmanager.heap.size: 1024m}}
--
This message was sent by Atlassian Jira
(v8.3.4#803005)