mmiklavc edited a comment on issue #1368: Metron-2053: Refactor metron-enrichment to decouple Storm dependencies URL: https://github.com/apache/metron/pull/1368#issuecomment-477798665 # Testing Plan ## Setup Test Environment * Build full dev `metron/metron-deployment/development/centos6$ vagrant up` * Login to full dev `ssh root@node1`, password "vagrant" * Set some environment variables - Note: set your metron version accordingly if using this test script in the future for a later version. ``` # version info export METRON_VERSION=0.7.1 export SOLR_VERSION=6.6.2 # paths export METRON_HOME=/usr/metron/${METRON_VERSION} export HDP_HOME=/usr/hdp/current export KAFKA_HOME=/usr/hdp/current/kafka-broker export SOLR_HOME=/var/solr/solr-${SOLR_VERSION} export ELASTIC_HOME=/usr/share/elasticsearch export KIBANA_HOME=/usr/share/kibana export STORM_LOGS=/var/log/storm/workers-artifacts # host info export METRON_HOST=node1 export ZOOKEEPER=${METRON_HOST}:2181 export BROKERLIST=${METRON_HOST}:6667 export STORM_UI=http://${METRON_HOST}:8744 export ELASTIC=http://${METRON_HOST}:9200 export ES_HOST=http://${METRON_HOST}:9200 export KIBANA=http://${METRON_HOST}:5000 ``` ## Basics Verify data is flowing through the system, from parsing to indexing 1. Open Ambari and navigate to the Metron service http://node1:8080/#/main/services/METRON/summary 2. Open the Alerts UI 3.  4. Verify alerts show up in the main UI - click the search icon (you may need to wait a moment for them to appear)  5. Head back to Ambari and select the Kibana service http://node1:8080/#/main/services/KIBANA/summary 6. Open the Kibana dashboard via the "Metron UI" option in the quick links 7.  8. Verify the dashboard is populating 9.  ## Profiler Verify profiler still works in Storm and the REPL. Pulled from https://github.com/apache/metron/blob/master/metron-analytics/metron-profiler-storm/README.md 1. First, we'll configure the profiler to emit a profile every 1 minute rather than every 15, for expediency: * First, stop the profiler * In Ambari, set the profiler period duration to `1` minute via the Profiler config section. * 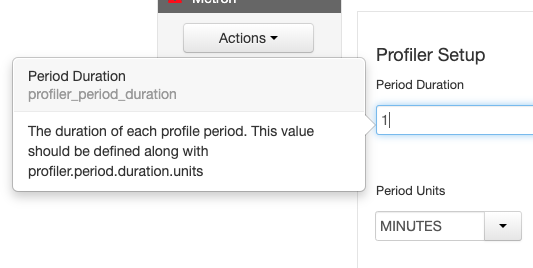 * Pull down latest global config to the local file system ```$METRON_HOME/bin/zk_load_configs.sh -m PULL -o ${METRON_HOME}/config/zookeeper -z $ZOOKEEPER -f``` * Adjust `$METRON_HOME/config/zookeeper/global.json` to adjust the capture duration: ``` "profiler.client.period.duration" : "1", "profiler.client.period.duration.units" : "MINUTES" ``` * Push the changes back up to Zookeeper ```$METRON_HOME/bin/zk_load_configs.sh -m PUSH -i $METRON_HOME/config/zookeeper/ -z $ZOOKEEPER``` 1. Start the Stellar Shell with the `-z` command line argument so that a connection to Zookeeper is established. This is required when deploying a new profile definition as shown in the steps below. ``` [root@node1 ~]# source /etc/default/metron [root@node1 ~]# $METRON_HOME/bin/stellar -z $ZOOKEEPER Stellar, Go! [Stellar]>>> ``` 1. If you haven't already, define your profile. ``` [Stellar]>>> conf := SHELL_EDIT() [Stellar]>>> conf { "profiles": [ { "profile": "hello-world", "onlyif": "exists(ip_src_addr)", "foreach": "ip_src_addr", "init": { "count": "0" }, "update": { "count": "count + 1" }, "result": "count" } ] } ``` 1. Check what is already deployed. Pushing a new profile configuration is destructive. It will overwrite any existing configuration. Check what you have out there. Manually merge the existing configuration with your new profile definition. ``` [Stellar]>>> existing := CONFIG_GET("PROFILER") ``` 1. Deploy your profile. This will push the configuration to to the live, actively running Profiler topology. This will overwrite any existing profile definitions. ``` [Stellar]>>> CONFIG_PUT("PROFILER", conf) ``` 1. Exit the Stellar REPL and now restart the profiler 1. Make sure the sensor stubs are running. ```service sensor-stubs start``` 1. Wait a few minutes - we want to wait some multiple of the period duration to ensure that the profiler has been able to flush data to HBase multiple times before we check in the next step. 1. Check the profiler is writing to HBase ``` echo "count 'profiler'" | hbase shell HBase Shell; enter 'help<RETURN>' for list of supported commands. Type "exit<RETURN>" to leave the HBase Shell Version 1.1.2.2.6.5.1050-37, r897822d4dd5956ca186974c10382e9094683fa29, Tue Dec 11 02:04:10 UTC 2018 count 'profiler' 24 row(s) in 0.9550 seconds ``` 1. Start the Stellar REPL back up again ``` [root@node1 ~]# $METRON_HOME/bin/stellar -z $ZOOKEEPER Stellar, Go! [Stellar]>>> ``` 1. Read values from the profiler. We'll first print out the help on PROFILE_GET and PROFILE_FIXED for context. The ip_src_addr I'm using below, "192.168.66.1," is pulled from one of the records in the alerts UI. ``` [Stellar]>>> ?PROFILE_GET PROFILE_GET Description: Retrieves a series of values from a stored profile. Arguments: profile - The name of the profile. entity - The name of the entity. periods - The list of profile periods to fetch. Use PROFILE_WINDOW or PROFILE_FIXED. groups - Optional - The groups to retrieve. Must correspond to the 'groupBy' list used during profile creation. Defaults to an empty list, meaning no groups. config_overrides - Optional - Map (in curly braces) of name:value pairs, each overriding the global config parameter of the same name. Default is the empty Map, meaning no overrides. Returns: The selected profile measurements. [Stellar]>>> ?PROFILE_FIXED PROFILE_FIXED Description: The profiler periods associated with a fixed lookback starting from now. Arguments: durationAgo - How long ago should values be retrieved from? units - The units of 'durationAgo'. config_overrides - Optional - Map (in curly braces) of name:value pairs, each overriding the global config parameter of the same name. Default is the empty Map, meaning no overrides. Returns: The selected profile measurement periods. These are ProfilePeriod objects. [Stellar]>>> PROFILE_GET("hello-world","192.168.66.1",PROFILE_FIXED(30, "MINUTES")) [158, 191, 184, 205, 178, 194, 180] ``` 1. You should see an array of the profile measurements, as indicated in the command output above. ## PCAP Steps adapted from https://github.com/apache/metron/pull/1157#issuecomment-412972370 Setup root user HDFS dir (only needed if running commands as root) ``` sudo -u hdfs hdfs dfs -mkdir /user/root sudo -u hdfs hdfs dfs -chown root:hdfs /user/root ``` Get PCAP data into Metron: 1. Install and setup pycapa (this has been updated in master recently) - https://github.com/apache/metron/blob/master/metron-sensors/pycapa/README.md#centos-6 2. (if using singlenode vagrant) You can kill the enrichment, profiler, indexing, and sensor topologies to free up resources, if needed, via `for i in bro enrichment random_access_indexing batch_indexing yaf snort;do storm kill $i;done` 3. Start the pcap topology if it's not already running via `$METRON_HOME/bin/start_pcap_topology.sh` 4. Start the pycapa packet capture producer on eth1 via `pycapa --producer --kafka-topic pcap --interface eth1 --kafka-broker $BROKERLIST` 5. Watch the topology in the Storm UI and kill the packet capture utility from before, when the number of packets ingested is over 3k. 6. Ensure that at at least 3 files exist on HDFS by running `hdfs dfs -ls /apps/metron/pcap/input` 7. Choose a file (denoted by $FILE) and dump a few of the contents using the pcap_inspector utility via `$METRON_HOME/bin/pcap_inspector.sh -i $FILE -n 5` 8. Choose one of the lines and note the protocol. 9. Note that when you run the commands below, the resulting file will be placed in the execution directory where you kicked off the job from. ### Run a fixed filter query 1. Run a fixed filter query by executing the following command with the values noted above (match your start_time format to the date format provided - default is to use millis since epoch) 2. `$METRON_HOME/bin/pcap_query.sh fixed -st <start_time> -df "yyyyMMdd" -p <protocol_num> -rpf 500` 3. Verify the MR job finishes successfully. Upon completion, you should see multiple files named with relatively current datestamps in your current directory, e.g. pcap-data-20160617160549737+0000.pcap 4. Copy the files to your local machine and verify you can them it in Wireshark. I chose a middle file and the last file. The middle file should have 500 records (per the records_per_file option), and the last one will likely have a number of records <= 500. ## Flatfile loader Make sure no classpath issues have broken it. Steps adapted from https://github.com/apache/metron/pull/432#issuecomment-276733075 ### Preliminaries * Download the alexa 1m dataset: ``` wget http://s3.amazonaws.com/alexa-static/top-1m.csv.zip unzip top-1m.csv.zip ``` * Stage import file ``` head -n 10000 top-1m.csv > top-10k.csv ``` * Create an extractor.json for the CSV data by editing `extractor.json` and pasting in these contents: ``` { "config" : { "columns" : { "domain" : 1, "rank" : 0 } ,"indicator_column" : "domain" ,"type" : "alexa" ,"separator" : "," }, "extractor" : "CSV" } ``` The extractor.json will get used by flatfile_loader.sh in the next step ### Import from HDFS via MR ``` # truncate hbase echo "truncate 'enrichment'" | hbase shell # import data into hbase $METRON_HOME/bin/flatfile_loader.sh -i /tmp/top-10k.csv -t enrichment -c t -e ./extractor.json -m MR # count data written and verify it's 10k echo "count 'enrichment'" | hbase shell ```
----------------------------------------------------------------
This is an automated message from the Apache Git Service.
To respond to the message, please log on to GitHub and use the
URL above to go to the specific comment.

For queries about this service, please contact Infrastructure at:
[email protected]


With regards,
Apache Git Services