[
https://issues.apache.org/jira/browse/SPARK-22286?page=com.atlassian.jira.plugin.system.issuetabpanels:comment-tabpanel&focusedCommentId=16769742#comment-16769742
 ]
t oo commented on SPARK-22286:
------------------------------

gentle ping

> OutOfMemoryError caused by memory leak and large serializer batch size in
> ExternalAppendOnlyMap
> -----------------------------------------------------------------------------------------------
>
>                 Key: SPARK-22286
>                 URL: https://issues.apache.org/jira/browse/SPARK-22286
>             Project: Spark
>          Issue Type: Bug
>          Components: Shuffle, Spark Core
>    Affects Versions: 2.1.1, 2.1.2
>            Reporter: Lijie Xu
>            Priority: Critical
>
> *[Abstract]*
> I recently encountered an OOM error in a simple _groupByKey_ application.
> After profiling the application, I found the OOM error is related to the
> shuffle spill and records (de)serialization. After analyzing the OOM heap
> dump, I found the root causes are (1) memory leak in ExternalAppendOnlyMap,
> (2) large static serializer batch size (_spark.shuffle.spill.batchSize_
> =10000) defined in ExternalAppendOnlyMap, and (3) memory leak in the
> deserializer. Since almost all the Spark applications rely on
> ExternalAppendOnlyMap to perform shuffle and reduce, this is a critical
> bug/defect. In the following sections, I will detail the testing application,
> data, environment, failure symptoms, diagnosing procedure, identified root
> causes, and potential solutions.
> *[Application]*
> This is a simple GroupBy application as follows.
> {code}
> table.map(row => (row.sourceIP[1,7], row)).groupByKey().saveAsTextFile()
> {code}
> The _sourceIP_ (an IP address like 127.100.101.102) is a column of the
> _UserVisits_ table. This application has the same logic as the aggregation
> query in Berkeley SQL benchmark (https://amplab.cs.berkeley.edu/benchmark/)
> as follows.
> {code}
>   SELECT * FROM UserVisits
>   GROUP BY SUBSTR(sourceIP, 1, 7);
> {code}
> The application code is available at \[1\].
> *[Data]*
> The UserVisits table size is 16GB (9 columns, 132,000,000 rows) with uniform
> distribution. The HDFS block size is 128MB. The data generator is available
> at \[2\].
> *[Environment]*
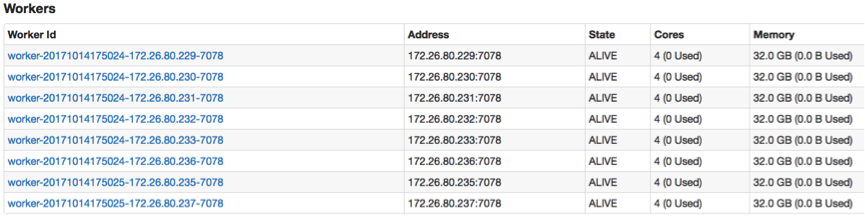
> Spark 2.1 (Spark 2.2 may also have this error), Oracle Java Hotspot 1.8.0, 1
> master and 8 workers as follows.
> !https://raw.githubusercontent.com/JerryLead/Misc/master/SparkPRFigures/OOM/Workers.png|width=100%!
> This application launched 32 executors. Each executor has 1 core and 7GB
> memory. The detailed application configuration is
> {code}
>    total-executor-cores = 32
>    executor-cores = 1
>    executor-memory = 7G
>    spark.default.parallelism=32
>    spark.serializer = JavaSerializer (KryoSerializer also has OOM error)
> {code}
> *[Failure symptoms]*
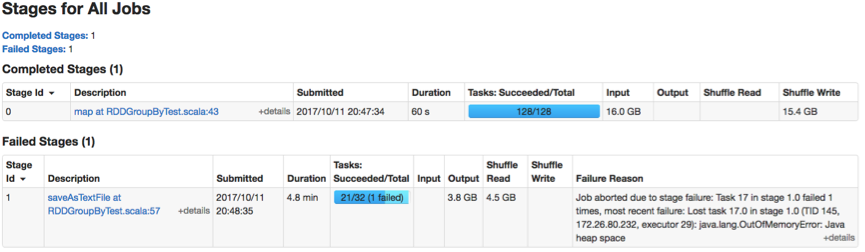
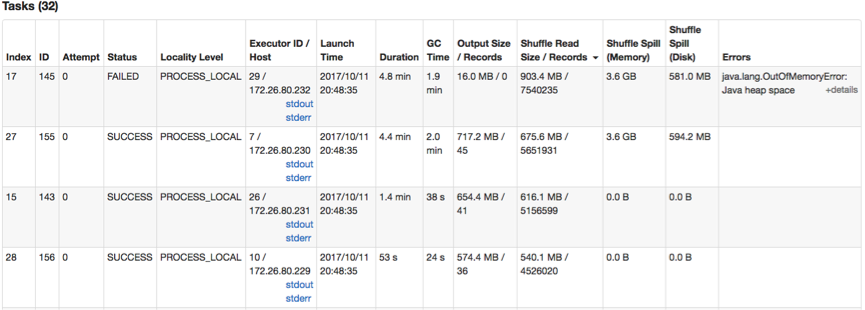
> This application has a map stage and a reduce stage. An OOM error occurs in a
> reduce task (Task-17) as follows.
> !https://raw.githubusercontent.com/JerryLead/Misc/master/SparkPRFigures/OOM/Stage.png|width=100%!
> !https://raw.githubusercontent.com/JerryLead/Misc/master/SparkPRFigures/OOM/Tasks.png|width=100%!
>
> Task-17 generated an OOM error. It shuffled ~1GB data and spilled 3.6GB data
> onto the disk.
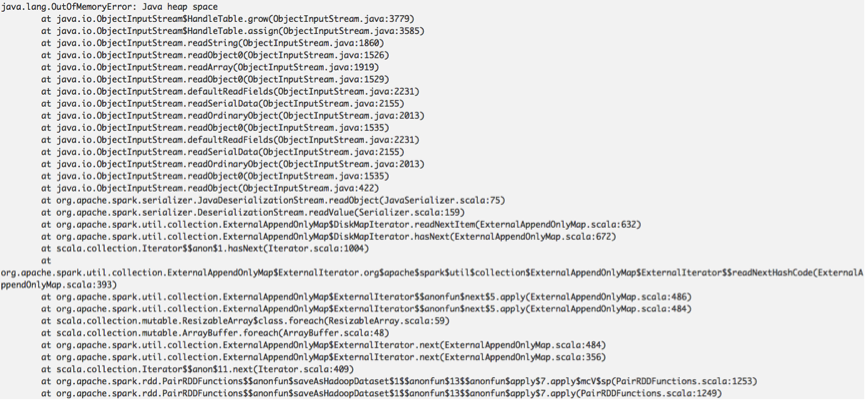
> Task-17 log below shows that this task is reading the next record by invoking
> _ExternalAppendOnlyMap.hasNext_(). From the OOM stack traces and the above
> shuffle metrics, we cannot identify the OOM root causes.
> !https://raw.githubusercontent.com/JerryLead/Misc/master/SparkPRFigures/OOM/OOMStackTrace.png|width=100%!
>
> A question is that why Task-17 still suffered OOM errors even after spilling
> large in-memory data onto the disk.
> *[Diagnosing procedure]*
> Since each executor has 1 core and 7GB, it runs only one task at a time and
> the task memory usage is going to exceed 7GB.
> *1: Identify the error phase*
> I added some debug logs in Spark, and found that the error phase is not the
> spill phase but the memory-disk-merge phase.
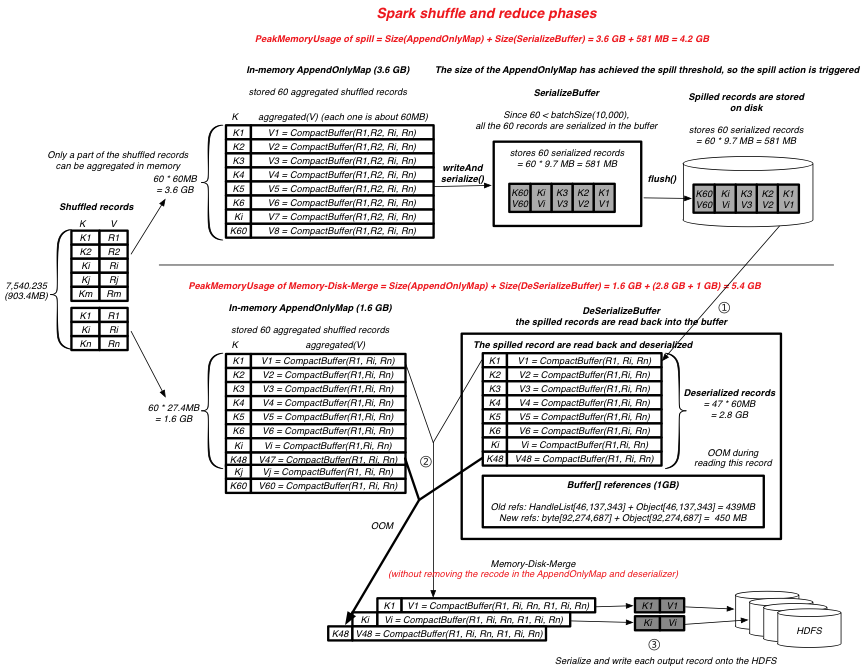
> The memory-disk-merge phase: Spark reads back the spilled records (as shown
> in ① Figure 1), merges the spilled records with the in-memory records  (as
> shown in ②), generates new records, and output the new records onto HDFS (as
> shown in ③).
> *2. Dataflow and memory usage analysis*
> I added some profiling code and obtained dataflow and memory usage metrics as
> follows. Ki represents the _i_-th key, Ri represents the _i_-th row in the
> table.
> !https://raw.githubusercontent.com/JerryLead/Misc/master/SparkPRFigures/OOM/DataflowAndMemoryUsage.png|width=100%!
>                           Figure 1: Dataflow and Memory Usage Analysis (see
> https://github.com/JerryLead/Misc/blob/master/SparkPRFigures/OOM/SPARK-22286-OOM.pdf
>  for the high-definition version)
> The concrete phases with metrics are as follows.
> *[Shuffle read]* records = 7,540,235, bytes = 903 MB
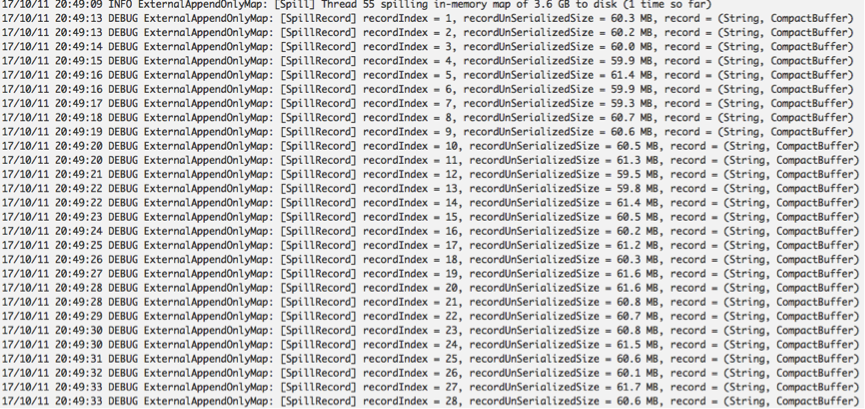
> *[In-memory store]* As shown in the following log, about 5,243,424 of the
> 7,540,235 records are aggregated to 60 <k, list(v)> records in AppendOnlyMap.
> Each <k, list(v)> record is about 60MB. There are only 60 distinct keys in
> the shuffled records.
> !https://raw.githubusercontent.com/JerryLead/Misc/master/SparkPRFigures/OOM/SpilledRecords.png|width=100%!
> *[Spill]* Since 3.6 GB has achieved the spill threshold, Spark spills the 60
> records onto the disk. Since _60 < serializerBatchSize_ (default 10,000), all
> the 60 records are serialized into the SerializeBuffer and then written onto
> the disk as a file segment. The 60 serialized records are about 581 MB (this
> is an estimated size, while the real size maybe larger).
> !https://raw.githubusercontent.com/JerryLead/Misc/master/SparkPRFigures/OOM/SpilledRecords2.png|width=100%!
> !https://raw.githubusercontent.com/JerryLead/Misc/master/SparkPRFigures/OOM/SpilledRecords3.png|width=100%!
>
> *[In-memory store]* After spilling, Spark released the old AppendOnlyMap
> (3.6GB) and allocated a new AppendOnlyMap. Then, Spark aggregated the rest
> 2,296,811 shuffled records into AppendOnlyMap. After aggregation,
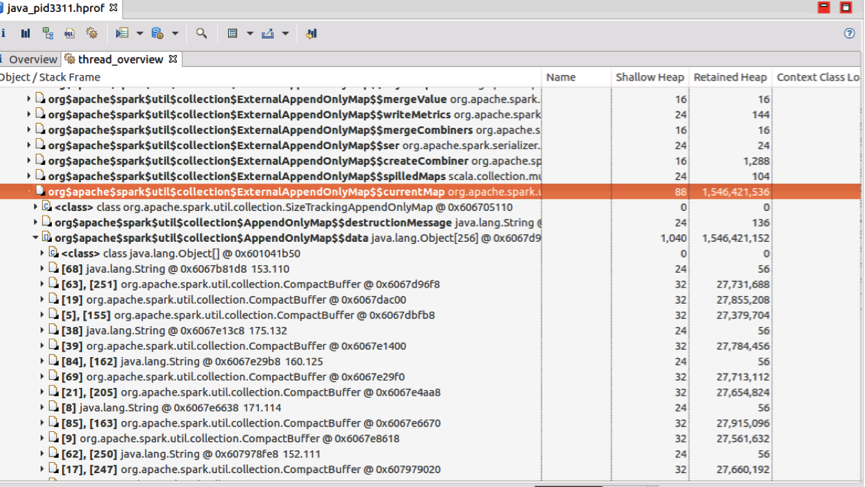
> AppendOnlyMap has 60 records, and each record is about 27 MB. The
> AppendOnlyMap is about 1.6 GB (shown as _currentMap_ in the heap dump).
> !https://raw.githubusercontent.com/JerryLead/Misc/master/SparkPRFigures/OOM/currentMap.png|width=100%!
>                             Figure 2 AppendOnlyMap in the heap dump
> *[Memory-Disk-Merge]* The next step is to merge the on-disk spilled records
> (60 records, unserilaizedSize=3.6GB, serializedSize=581MB) with the in-memory
> records in AppendOnlyMap (60 records/1.6 GB). As shown in Figure 1, for each
> spilled record Rec_i, Spark uses Java/Kryo deserializer to deserialize Rec_i
> into the _DeSerializeBuffer_, merges Rec_i with the in-memory record with the
> same key, generates new record, and finally outputs the new record onto HDFS.
> This procedure is assumed to be pipelined with low memory consumption
> (without any accumulation of records and intermediate results). However, the
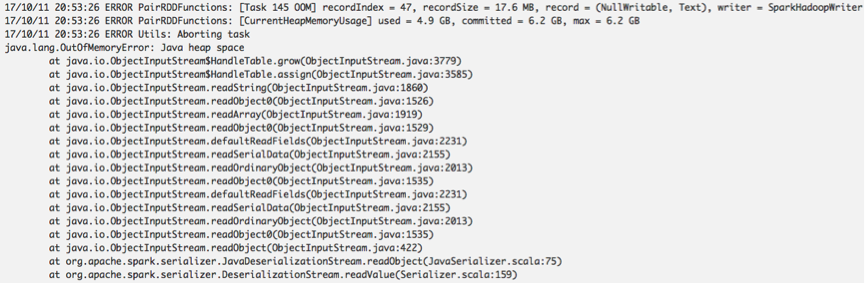
> task generated an OOM error in this procedure (while merging the 48-th
> spilled record with the 48-th record in AppendOnlyMap). The following log in
> _PairRDDFunctions. saveAsNewAPIHadoopDataset_() shows this fact.
> !https://raw.githubusercontent.com/JerryLead/Misc/master/SparkPRFigures/OOM/StackTrace2.png|width=100%!
> Then, I dump the OOM heap. The heap dump below shows that the memory
> consumption mainly consists of three parts:
> *(1) AppendOnlyMap (1.6GB, 60 records, avgRecordSize = 27.4MB)* (Figure 2)
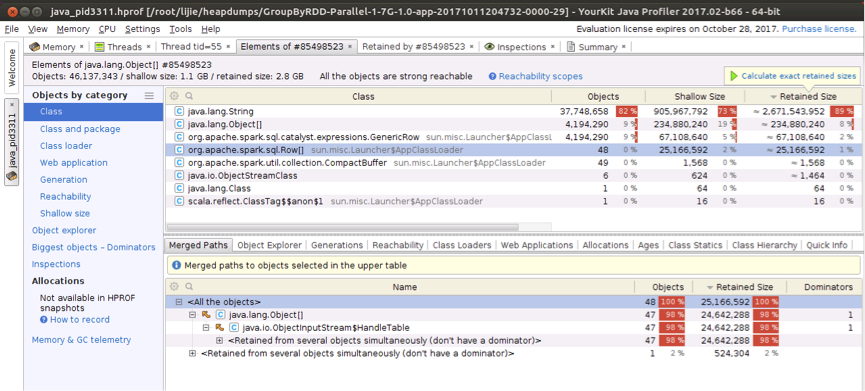
> *(2) Spilled records buffed in _DeSerializeBuffer_ (about 3GB)*
> !https://raw.githubusercontent.com/JerryLead/Misc/master/SparkPRFigures/OOM/DeSerializeBuffer.png|width=100%!
> The above figures shows that 48 spilled records are buffered in
> _DeSerializeBuffer_ (_HandleTable_) with about 2.6GB String and 300MB other
> objects.
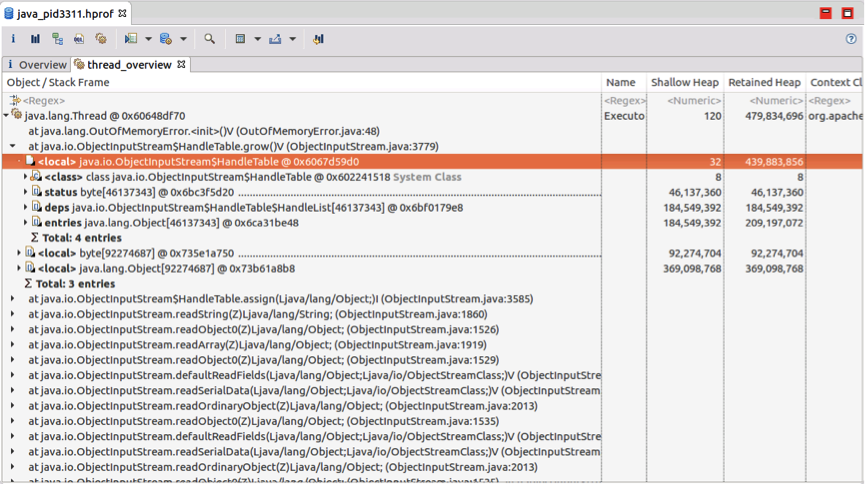
> *(3) Object\[\] references in _DeSerializeBuffer_ (~1GB)*, including
> _HandleTable_ references (status+deps+entries, 439MB), growed object\[\]
> references due to data structure expansion (byte\[92274687\] +
> Object\[92274687\], 450MB).
>
> !https://raw.githubusercontent.com/JerryLead/Misc/master/SparkPRFigures/OOM/ObjectReferences.png|width=100%!
> The left space 7GB - (1.6GB + 3GB + 1GB) = 1.4 GB has been used for other
> objects and JVM GC swap space.
> *[Identified root causes]*
> The above analysis reveals the root cause: the spilled records and in-memory
> records are still kept in memory even they have been merged. The root causes
> can be further summarized as follows.
> *(1) Memory leak in _ExternalyAppendOnlyMap_:* The merged in-memory records
> in AppendOnlyMap are not cleared after Memory-Disk-Merge.
> *(2) Large serializer batch size:*
> The _serializerBatchSize_ ("spark.shuffle.spill.batchSize", 10000) is too
> arbitrary and too large for the application that have small aggregated record
> number but large record size. For these applications, all the spilled records
> (3.6GB in this case) will be serialized in a buffer and written as a whole
> file segment at a time. In other words, the 3.6GB records will be read back
> to memory at a time. Other applications that have large record number with
> small record size may be OK, because the spilled records may be serialized
> and written to many files. In other words, the 3.6GB records will be read
> back to memory in several times with low memory consumption.
> *(3) Memory leak in deserializer:* The spilled records are not cleared from
> the _DeSerializeBuffer_ after Memory-Disk-Merge, which leads to both large
> buffer and large object references.
> *[Potential solutions]*
> For each root cause, we can
> *(1) Handle memory leak in ExternalyAppendOnlyMap:* Remove the records in
> both in AppendOnlyMap and read-back-spilledMap once the in-memory records
> have been merged. Current AppendOnlyMap (the following currentMap) does not
> delete the merged records until all of the records in it have been merged.
> {code}
> private val sortedMap = CompletionIterator[(K, C), Iterator[(K,
> C)]](destructiveIterator(
>       currentMap.destructiveSortedIterator(keyComparator)), freeCurrentMap()))
> {code}
> *(2) Adaptive serializer batch size instead of static spill threshold and
> static serializerBatchSize:* Since we can dynamically obtain (estimate) the
> record number and bytes in AppendOnlyMap, we can estimate the size of
> serialize/deserialize buffer size when the spill threshold is achieved. Based
> on this information, we can accordingly lower the batch size to write the
> serialized records into multiple file segments.
> *(3) Handle memory leak in the deserializer:* Try to remove the merged
> spilled records in the deserializer or design a new deserializer.
> The whole task OOM log can is available at \[3\].
> *[References]*
> \[1\] The GroupBy application code.
> https://github.com/JerryLead/SparkGC/blob/master/src/main/scala/applications/sql/rdd/RDDGroupByTest.scala
> \[2\] Data generator.
> https://github.com/JerryLead/SparkGC/tree/master/datagen/sql/htmlgen
> \[3\] Task-17 stderr log.
> https://github.com/JerryLead/Misc/blob/master/SparkPRFigures/OOM/Task-17-log.txt


--
This message was sent by Atlassian JIRA
(v7.6.3#76005)

---------------------------------------------------------------------
To unsubscribe, e-mail: [email protected]
For additional commands, e-mail: [email protected]