     [
https://issues.apache.org/jira/browse/SPARK-32107?page=com.atlassian.jira.plugin.system.issuetabpanels:all-tabpanel
 ]
Takeshi Yamamuro resolved SPARK-32107.
--------------------------------------
Resolution: Invalid
> Dask faster than Spark with a lot less iterations and better accuracy
> ---------------------------------------------------------------------
>
> Key: SPARK-32107
> URL: https://issues.apache.org/jira/browse/SPARK-32107
> Project: Spark
> Issue Type: Question
> Components: MLlib
> Affects Versions: 2.4.5
> Environment: Anaconda for Windows with PySpark 2.4.5
> Reporter: Julian
> Priority: Minor
>
> Hello,
> I'm benchmarking k-means clustering Dask versus Spark.
> Right now these are only benchmarks on my laptop, but I've some interesting
> results and I'm looking for an explanation before I further benchmark this
> algorithm on a cluster.
> I've logged the execution time, model cluster predictions, iterations. Both
> benchmarks used the same data with 1.6 million rows.
> The questions are:
> * Why does Spark need a lot more iterations than Dask?
> * Why is clustering less accurate in Spark than in Dask?
> I'm unclear why those are different, because they both use the same
> underlying algorithm and have more or less the same standard parameter.
> *Dask*
> KMeans( n_clusters=8, init='k-means||', oversampling_factor=2, max_iter=300,
> tol=0.0001, precompute_distances='auto', random_state=None, copy_x=True,
> n_jobs=1, algorithm='full', init_max_iter=None, )
> *Spark*
> I've set maxIter to 300 and reset the seed for every benchmark.
> KMeans( featuresCol='features', predictionCol='prediction', k=2,
> initMode='k-means||', initSteps=2, tol=0.0001, maxIter=20, seed=None,
> distanceMeasure='euclidean', )
> Here you can see the duration of execution of each k-means clustering
> together with the iterations used to get a result. Spark is a lot slower than
> Spark on the overall calculation, but needs also a lot more iterations.
> Interestingly Spark is faster per iteration (the slope of a regression line)
> and faster on initialization (the y-intercept of the regression line). For
> the Spark benchmarks one can also make out a second line which I couldn't yet
> explain.
> [!https://user-images.githubusercontent.com/31596773/85844596-4564af00-b7a3-11ea-90fb-9c525d9afaad.png!|https://user-images.githubusercontent.com/31596773/85844596-4564af00-b7a3-11ea-90fb-9c525d9afaad.png]
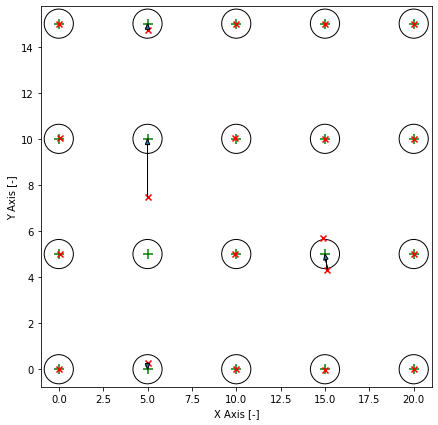
> The training data is equally spaced grid. The circles around the cluster
> centers are the standard deviation. Clusters are overlapping and it is
> impossible to get a hundred percent accuracy. The red markers are the
> predicted cluster centers and the arrow shows their correspoding cluster
> center. In this example the clustering is not correct. One cluster was on the
> wrong spot and two predicted cluster centers share one cluster center. I can
> make these plots for all models.
> [!https://user-images.githubusercontent.com/31596773/85845362-6974c000-b7a4-11ea-9709-4b32833fe238.png!|https://user-images.githubusercontent.com/31596773/85845362-6974c000-b7a4-11ea-9709-4b32833fe238.png]
> The graph on the right makes everything much weirder. Apperently the Spark
> implementation is less accurate than the Dask implementation. Also you can
> see the distribution of the duration and iterations much butter (These are
> seaborn boxenplots).
> [!https://user-images.githubusercontent.com/31596773/85865158-c2088500-b7c5-11ea-83c2-dbd6808338a5.png!|https://user-images.githubusercontent.com/31596773/85865158-c2088500-b7c5-11ea-83c2-dbd6808338a5.png]
> I'm using Anaconda for Windows and PySpark 2.4.5 and Dask 2.5.2.
> I filed this issue for [Dask|https://github.com/dask/dask-ml/issues/686] and
> [Spark|https://issues.apache.org/jira/browse/SPARK-32107].
> Best regards
> Julian
--
This message was sent by Atlassian Jira
(v8.3.4#803005)
---------------------------------------------------------------------
To unsubscribe, e-mail: [email protected]
For additional commands, e-mail: [email protected]