I see some errors in that already -- corrected here.
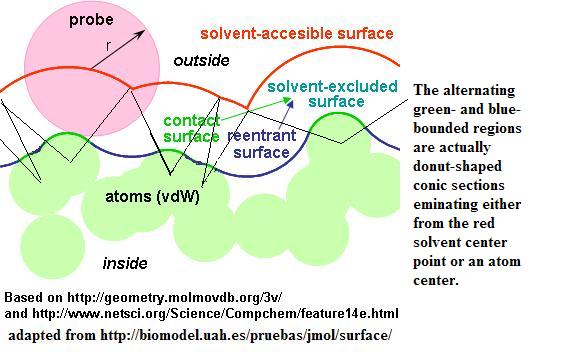
-------- Original Message --------
Subject:        thoughts on surface rendering
Date:   Sat, 07 Oct 2006 06:25:37 -0500
From:   Bob Hanson <[EMAIL PROTECTED]>
To:     jmol-users@lists.sourceforge.net, Miguel
<[EMAIL PROTECTED]>


This email describes how Jmol renders molecular surfaces and their
derivative, "solvent accessible surfaces" and how Jmol produces a slice
through the data. It's fairly technical. Those interested in surfaces,
feel free to contribute to the discussion.

The two practical points made here include:

1) If you want a "solvent" or "molecular" surface, consider trying

isosurface solvent 0

first, before

isosurface molecular

or it's equivalent,

isosurface solvent 1.4

"isosurface solvent 0" will probably render just about instantaneously
(30-100 ms for large systems), while the second may take several
seconds. And they look ALMOST identical.

2) Consider using one or more planar slices to depict the surface. I
don't know if any other program does this, but it is extraordinarily
fast, even with large systems, even with "isosurface molecular"

isosurface plane z=3 molecular


OK, Angel sent me this article, which I'll refer to as "CCW":

Tolga Can a,*, Chao-I Chen b, Yuan-Fang Wang
Efficient molecular surface generation using level-set methods
Journal of Molecular Graphics and Modelling 25 (2006) 442–454

It's about a fast method of calculating molecular surfaces using a
"level-set" idea -- that what you do is start at the atom centers and
work your way out step by step, syncing the steps by starting some atoms
later than others. The idea is to move out from the atom centers in sort
of a bubble-like front. In this way, all van der Waals surfaces are
found at the same time, and the calculation is very efficient.

I've read this article some, and I can't say I understand EXACTLY what
is going on there, but I have the main idea. The reason Jmol's surface
rendering just improved by 200 - 10000% is because I implemented
something they regard as "simple but inefficient" -- a "molecule-based"
approach rather than what we had before, which was a grossly inefficient
"grid-based" approach. So we went from "grossly inefficient" to
"inefficient".

What we were doing was true brute force -- for every position in space,
measure the distance from every atom, with O(Nd^3). Then, again for every
point in space, for every possible pair of atoms, see whether this point
is in a "special" position relative to a solvent probe that might be touching
both atoms. Obviously this approach is a problem for large systems and
grows by something like O(N^2 d^3) where N is the number of atoms and d
is the grid dimension. (I note that Miguel had nothing to do with
introducing this inefficiency -- it was all my doing, my first stab at
turning a solvent surface into an isosurface.)

The improvement comes from two sources:

1) I switched to Miguel's "WithinModelIterator", which efficiently and
drastically speeds up the search for nearby atoms, which reduces O(N^2)
to something like O(NlogN), and

2) I implemented sort of a molecule-based mini-grid method, which
confines the grid search to a box just big enough to hold the sphere
around the atom. The removes the grid-based O(Nd^3) and replaces it with
O(Nm) where m is the average number of voxels per atom.

Generally d is around 50-60, and m is around 100-300, so you can see
that going from 50^3 to 300 is an improvement of 125000/300 = about 400:1.

So that's a nice improvement.

Mostly what I wanted to mention (not because I think anyone is
interested; more just for the record) are four things:

1) What I mean by "cubic molecular/solvent data".
2) How Jmol treats solvent-probe contacts, because I think that's kind
of novel.
3) How interesting it is to map a *plane* with "surface data".
4) In the context of a plane, how the process can be sped up immensely.


1) "cubic molecular/solvent data"

The isosurface command define a surface in terms of a cubic array of
data values. Jmol creates or is given a cube of data, some point of
which are "inside", f(x,y,z) ? C, and some of which are outside --
f(x,y,z) !? C), where C is some cutoff value and ? is either < or >. For
solvent/molecular surfaces we use C=0, and ? is <, so negative values
mean within the surface and positive values mean outside the surface.

Now, it's not enough just to say "1 is outside; -1 is inside," because
if you do that, you get a very ugly, blocky looking rendering. What you
need is a smoothly varying parameter that specifies *how far* a point is
from a surface -- from the nearest point on a surface. Given that, Jmol
can use the Marching Cubes algorithm to render a nice, smooth surface.

2) How Jmol treats solvent-probe contacts

So here's what I implemented: If you consider the diagram I stole from
Angel, at
http://www.stolaf.edu/academics/chemapps/jmol/docs/img/jmol_surfaces.jpg,
you can see that the "molecular surface" actually consists of two
alternating parts -- concave inward (green, van der Waals "contact"
surface) and concave outward (blue, "re-entrant surface"). The same
parameter has to be used in each case, but the trick is this:

In the contact (green) regions we measure from the atom;
in the re-entrant (blue) regions we measure from the solvent.

This turns out to be a huge simplification. Originally when Miguel and I
worked on this, we thought that you had to consider where the solvent
touches three atoms. But this is not necessary. Every contact can be
seen as a contact of the solvent with either one or two atoms.

The only additional trick I use is that if a grid point is visited
twice, because it is within two or more atoms' van der Waals radius, or
we are looking for that re-entrant surface, then the rule is this:

only change a measurement if it makes the value smaller
(closer to an atom) than you already have at that point

The effect of this is that once a point is found inside a surface, it
can never be later defined as outside, only "more inside", and if a
point is found to be outside, a later measurement may bring it inside.

CCW propose that one need not ever revise a grid point value with their
method, and that may be true. Right now in Jmol we allow some revisions
along these lines. So maybe there's still lots of room for improvement.


So that's what we do in Jmol.

Right now I'm still doing a rather brute force search for those
re-entrant surfaces, so there's room for improvement there. And if you
are interested in the molecular surface but don't particularly care
about the smoothness of it, consider using

isosurface solvent 0

or

isosurface sasurface 0

(which are the same) instead of

isosurface molecular

or it's equivalent,

isosurface solvent 1.4


"isosurface solvent 0" and "isosurface sasurface 0" both set the solvent
radius to 0, which is identical to saying we just want the van der Waals
radius. This is far faster, because the nearby-atom re-entrant surface
calculation is avoided.


3) How interesting it is to map a *plane* with "surface data"

OK, as I was reading CCW, I was very impressed that they had considered
the idea of cavities. We can look inside our Jmol surfaces using slab,
and I just recently added a colorScheme I call "sets" that allows you to
color the surface triangles based on which connected set of triangles it
is in. This turns out to be very pretty.

But what you really want to do is slice right through a molecular
surface and see where it has holes in it. So here was my idea: Take the
molecular surface data and consider it like a molecular orbital, with a
value at every point in space -- not a 2D object, but 3D.

Now you can map that data onto any plane. I just have Jmol throw out any
point that is outside the surface. (Really what I have Jmol do is set
any positive value to 0.001, which creates a constant-color field around
the perimeter of the molecule, and Jmol automatically hides the
perimeter color for data slices.) The result is quite pleasing, I think.
See, for example the examples at
http://www.stolaf.edu/academics/chemapps/jmol/docs/examples-11/new.htm

I happen to think this is very cool. Planar slices can be powerful
visualization tools.

4) In the context of a plane, how the process can be sped up immensely.

If you think about data and a plane, which is just a very small
two-dimensional grid, we can speed up the process measurably by not even
considering atoms that are distant from the plane. When I added this
feature, the data-calculation time for small proteins went down by
roughly a factor of 3, even for molecular surfaces. The improvement for
larger systems is even higher.

I thought about just abandoning the 3D grid for a plane entirely and
just confining the calculation to the plane, but I haven't tried that
yet. (It may or may not give any improvement. The problem is that you
don't just need the values at the planar grid points. You need the
values at every corner and every edge crossing of a contour level, and
that's a LOT of points. It's easier just to get the 3D grid and derive
the plane-based data from that.)

OK, so that's for the record. Room for improvement, for sure.

Bob


-------------------------------------------------------------------------
Take Surveys. Earn Cash. Influence the Future of IT
Join SourceForge.net's Techsay panel and you'll get the chance to share your
opinions on IT & business topics through brief surveys -- and earn cash
http://www.techsay.com/default.php?page=join.php&p=sourceforge&CID=DEVDEV
_______________________________________________
Jmol-users mailing list
Jmol-users@lists.sourceforge.net
https://lists.sourceforge.net/lists/listinfo/jmol-users