Quick question on GR usage.

I'd like to be able to plot multiple plots on the same figure with multiple
commands (in Julia)
Currently this works:
plot(t,BezierBasis(1,order,knot_v,t),"b",t,BezierBasis(2,order,knot_v,t),"b")
But what I'd like to do is this:
for i = 1:length(knot_v)
plot(t,BezierBasis(i,order,knot_v,t),"b")
end
In MATLAB there was a command "hold on" to do this. Is there a way to do
this yet in GR?
Thanks!
-Steven
On Monday, February 29, 2016 at 3:54:15 AM UTC-7, Josef Heinen wrote:
>
> I finally found some time to upgrade the GR framework
> <http://gr-framework.org>. It can now be used as a further alternative
> backend for Plots.jl <https://github.com/tbreloff/Plots.jl>, a wrapper
> for several plotting packages. The results can be seen here
> <http://plots.readthedocs.org/en/latest/examples/gr/>. In addition there
> are now also several convenience functions allowing to use GR quite similar
> to MATLAB's plot functions.
>
> So, with the recent version, there's even more interoperability with
> different plotting environments, e.g.
>
> - use GR as a backend for Matplotlib (Demos
> <http://gr-framework.org/tutorials/matplotlib.html>)
> - use GR as a backend for Plots.jl (Demo
> <http://pgi-jcns.fz-juelich.de/pub/doc/ExamplePlots.html>)
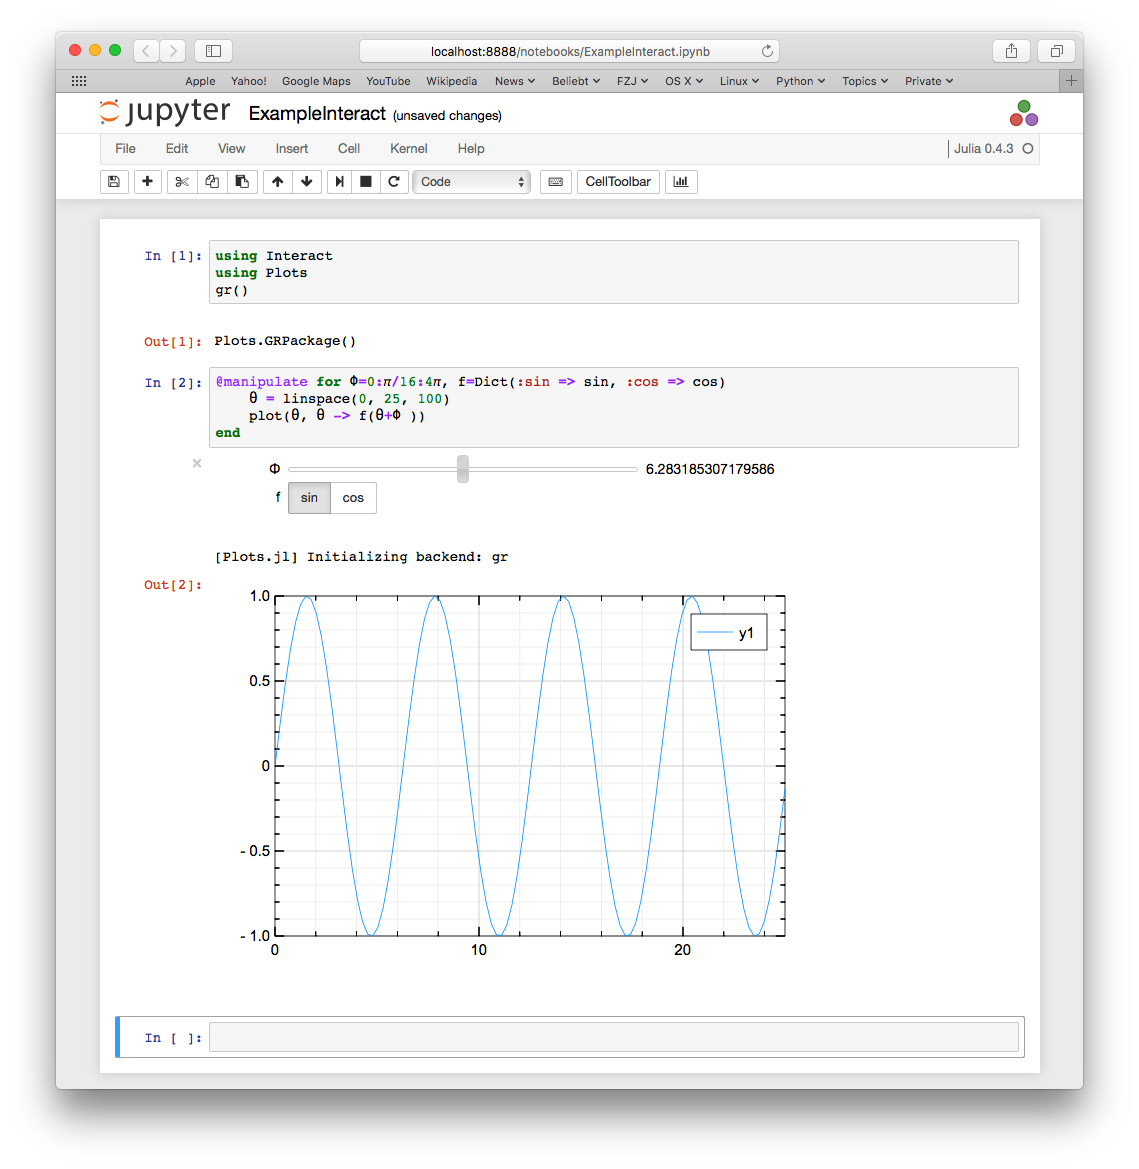
> - user interaction by means of Interact.jl (Demo
> <https://pbs.twimg.com/media/CaCpZL7WwAALMWp.png:large>)
> - use GR native MATLAB-like plot functions (Link
> <https://twitter.com/josef_heinen/status/702177574978527234>)
>
> The latter is still incomplete, but I will add more functions ASAP.
>
> May be, there is also a chance to combine GR with Simon's powerful
> GLvisualize.jl <http://www.glvisualize.com> library - we are open to
> anything.
>