https://bugs.documentfoundation.org/show_bug.cgi?id=90936
Bug ID: 90936
Summary: Quick option to filter chart with automatic pattern
Product: LibreOffice
Version: unspecified
Hardware: Other
OS: All
Status: UNCONFIRMED
Severity: normal
Priority: medium
Component: Calc
Assignee: [email protected]
Reporter: [email protected]
Dear all,
I became recently aware of the problem of color blindness:
"Colour (color) blindness (colour vision deficiency, or CVD) affects
approximately 1 in 12 men (8%) and 1 in 200 women in the world. In Britain this
means that there are approximately 2.7 million colour blind people (about 4.5%
of the entire population), most of whom are male."
http://www.colourblindawareness.org/colour-blindness/
This made me think how I can publish charts that are easy to read for
colourblind people. I realised that currently it is not easy to apply an
automatic pattern to a chart.
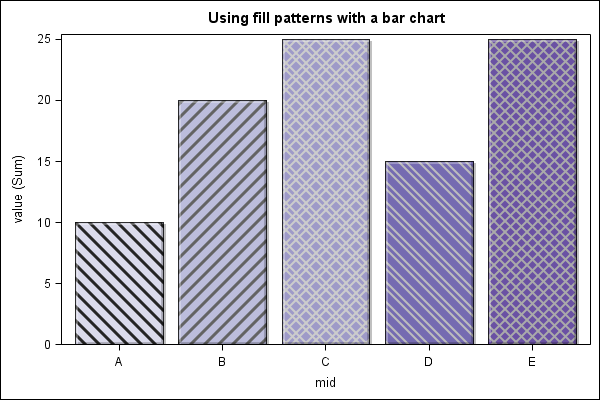
By pattern I mean an example like this:
http://support.sas.com/kb/45/addl/fusion_45663_1_fillpatterns1.png
Instead I have to modify the colour for each of the individual data ranges.
I would like to hear your opinion whether we could imagine an option that
automatically applies a pattern design to an entire chart.
Thanks,
Robert
--
You are receiving this mail because:
You are the assignee for the bug.
_______________________________________________
Libreoffice-bugs mailing list
[email protected]
http://lists.freedesktop.org/mailman/listinfo/libreoffice-bugs