https://bugs.freedesktop.org/show_bug.cgi?id=58244
Priority: medium
Bug ID: 58244
Assignee: [email protected]
Summary: Impossible to display non numeric values (labels) in
bubble charts axis (for categorized data)
Severity: normal
Classification: Unclassified
OS: All
Reporter: [email protected]
Hardware: All
Status: NEW
Version: 3.6.2.2 release
Component: Chart
Product: LibreOffice
Created attachment 71448
--> https://bugs.freedesktop.org/attachment.cgi?id=71448&action=edit
Example data showing no string labels are possible on bubble chart axis
Bubble charts allows to display data having 3 dimensions, where the first two
are used to place the bubble in a X,Y grid and the third one to size the bubble
itself.
However it works only when X and Y are numerical values, while it doesn't work
instead when they are strings (useful for categorized data, where the X and Y
dimensions are categories rather than continuous values).
This is an odd behaviour as most other type of charts are able to place strings
on their axis.
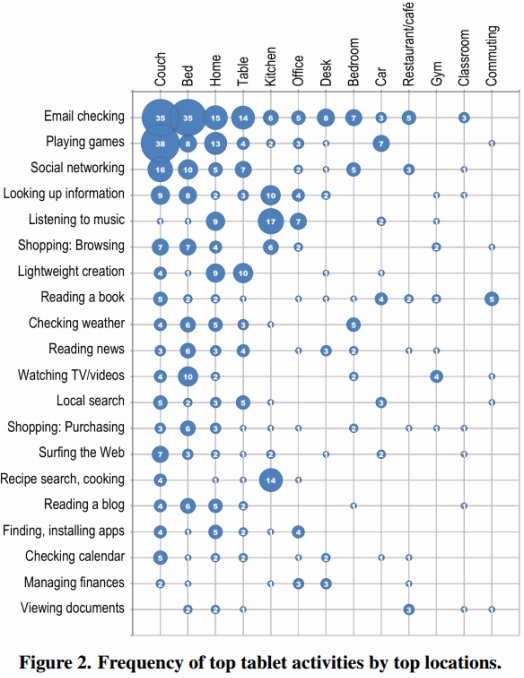
Here is an example of what I'd like to achieve:
http://static.ipaditalia.com/wp-content/uploads/2012/10/google_tablet_research_locations.jpg
I attach some example data.
Thank you ;-)
--
You are receiving this mail because:
You are the assignee for the bug.
_______________________________________________
Libreoffice-bugs mailing list
[email protected]
http://lists.freedesktop.org/mailman/listinfo/libreoffice-bugs