----------------------------------------------------------------------
Date: Tue, 27 May 2014 13:34:20 +0200
From: Randy Wijnants <[email protected]>
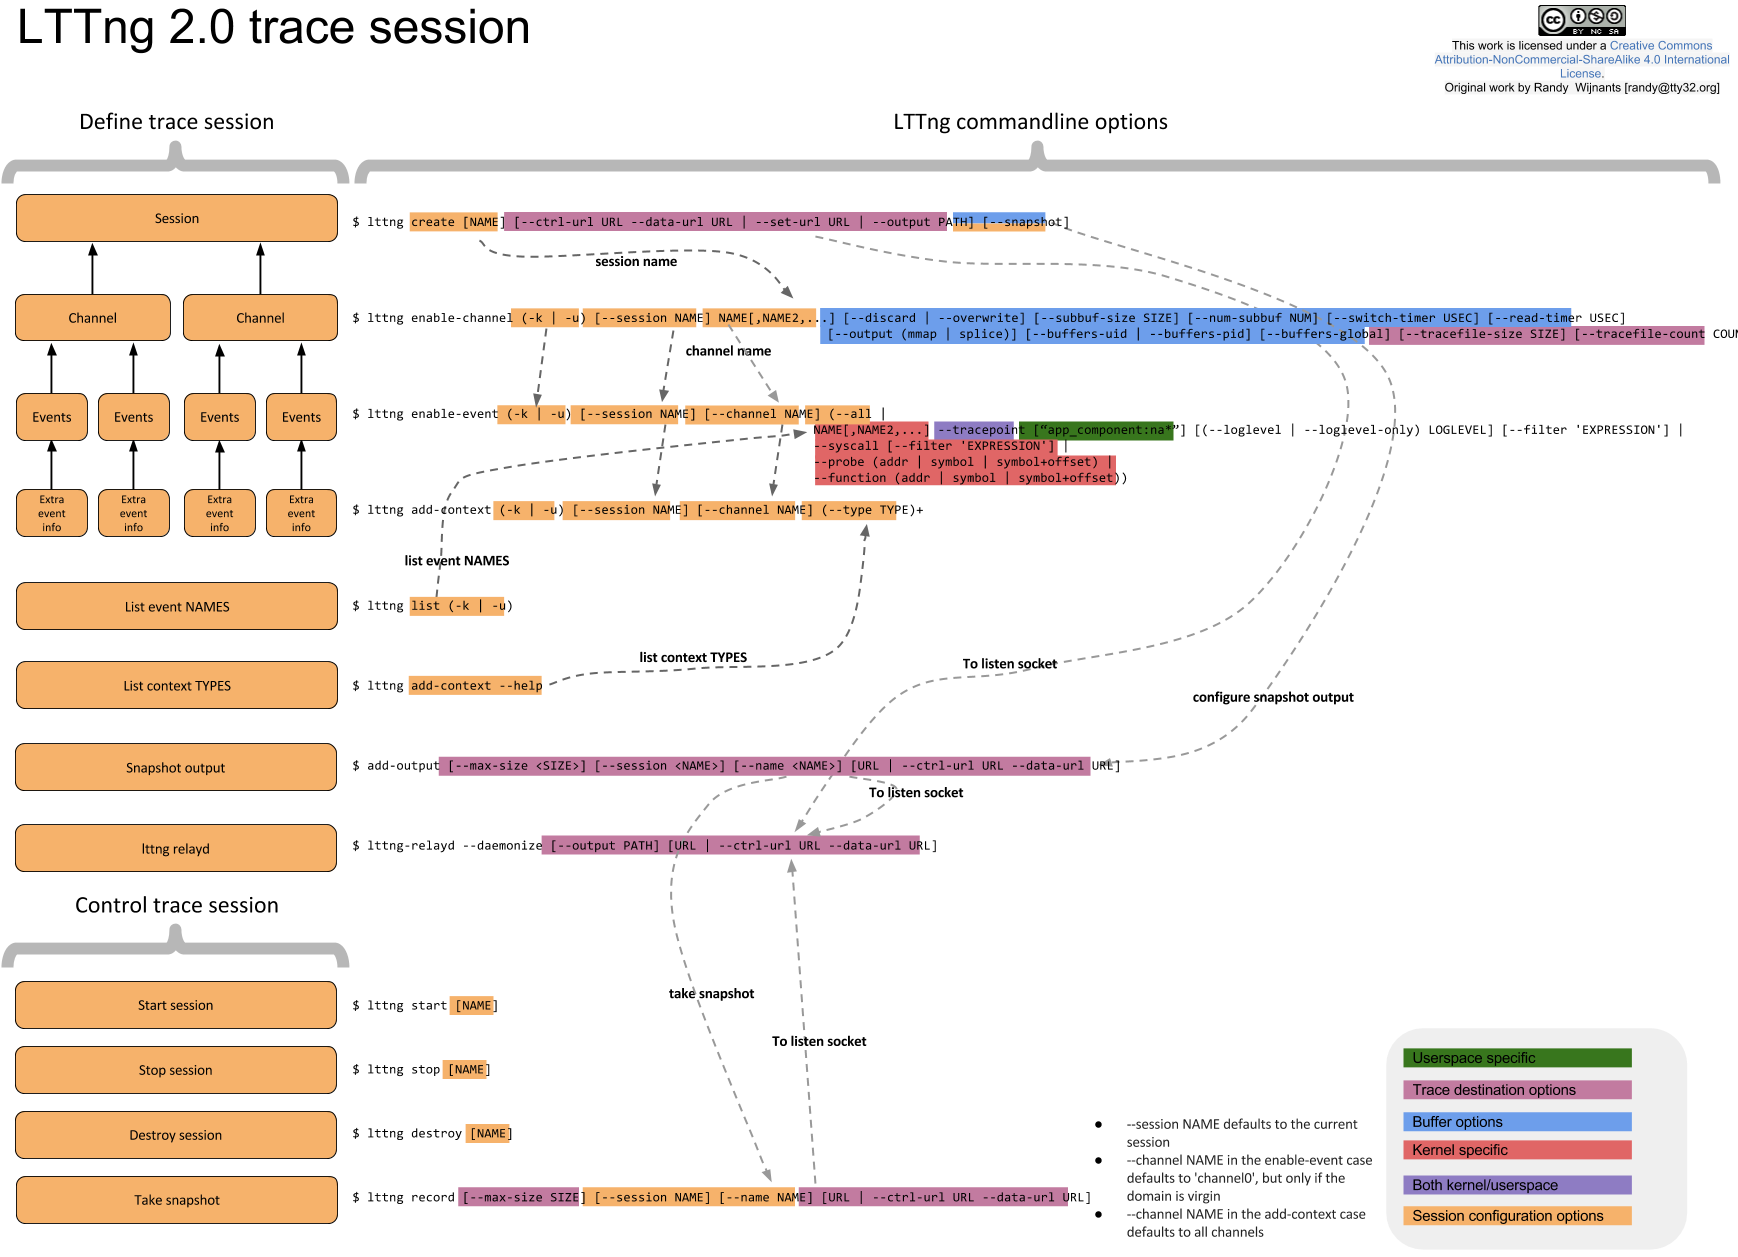
> In addition to the LTTng architecture diagram, I've drawn a diagram that
> shows the relation between the command line options and how to configure a
> trace session.
> I hope it proves to be useful, if you have any suggestions let me know!
>
> Originally posted on IRC. As suggested by Compudj i've released it under CC
> license.
>
> http://tty32.org/Trace%20session.png
> http://tty32.org/Trace%20session.svg
>
> Randy Wijnants.
----------------------------------------------------------------------

   Neither the png nor svg versions line up correctly the text and coloured
boxes with each other.  This may be a local rendering issue.  At least the svg
version has a proper white background (my png renders with a very dark grey
background, making it very hard to make out some of the text).  However, the
svg version is unusable because none of the text is text: everything is
svg:path with opaque d attributes (this may explain the alignment problems).

   Here are improved (more accurate) expressions for the various command
syntaxes:

$ lttng create [NAME] [--ctrl-url URL --data-url URL | --output PATH |
--set-url URL | --no-output] [--snapshot]
   (the ctrl-url etc. options are in pre-emption order)

$ lttng enable-channel (-k | -u) [--session NAME] NAME[,NAME2,...] [--discard |
--overwrite] [--subbuf-size SIZE] [--num-subbuf NUM] [--switch-timer USEC]
[--read-timer USEC] \

                                [--output (mmap | splice)] [--buffers-uid |
--buffers-pid | --buffers-global] [--tracefile-size SIZE [--tracefile-count
COUNT]]

$ lttng enable-event (-k | -u) [--session NAME] [--channel NAME] (--all
[--tracepoint | --syscall] | \
                                            NAME[,NAME2,...] [--tracepoint
[(--loglevel | --loglevel-only) LOGLEVEL] [--filter 'EXPRESSION'] | (--probe |
--function) (addr | symbol | symbol+offset)])

$ lttng add-context (-k | -u) [--session NAME] [--channel NAME] (--type TYPE)+

$ lttng list (-k | -u)
   (not the full syntax, but rather the syntax that will get just a list of
event names)

$ lttng add-context --help
   (the only one that doesn't change!)

   Change "Kernelspace specific" into "Kernel specific".

   Add footnotes:
* --session NAME defaults to the current session
* --channel NAME in the enable-event case defaults to 'channel0', but only if
the domain is virgin
* --channel NAME in the add-context case defaults to all channels

Daniel U. Thibault
Protection des systèmes et contremesures (PSC) | Systems Protection &
Countermeasures (SPC)
Cyber sécurité pour les missions essentielles (CME) | Mission Critical Cyber
Security (MCCS)
R & D pour la défense Canada - Valcartier (RDDC Valcartier) | Defence R&D
Canada - Valcartier (DRDC Valcartier)
2459 route de la Bravoure
Québec QC  G3J 1X5
CANADA
Vox : (418) 844-4000 x4245
Fax : (418) 844-4538
NAC : 918V QSDJ <http://www.travelgis.com/map.asp?addr=918V%20QSDJ>
Gouvernement du Canada | Government of Canada
<http://www.valcartier.drdc-rddc.gc.ca/>

_______________________________________________
lttng-dev mailing list
[email protected]
http://lists.lttng.org/cgi-bin/mailman/listinfo/lttng-dev