Hi. I am currently using *plot_wireframe* to create 3D wireframe images.
Is there any way to add a color gradient to these types of figures similar
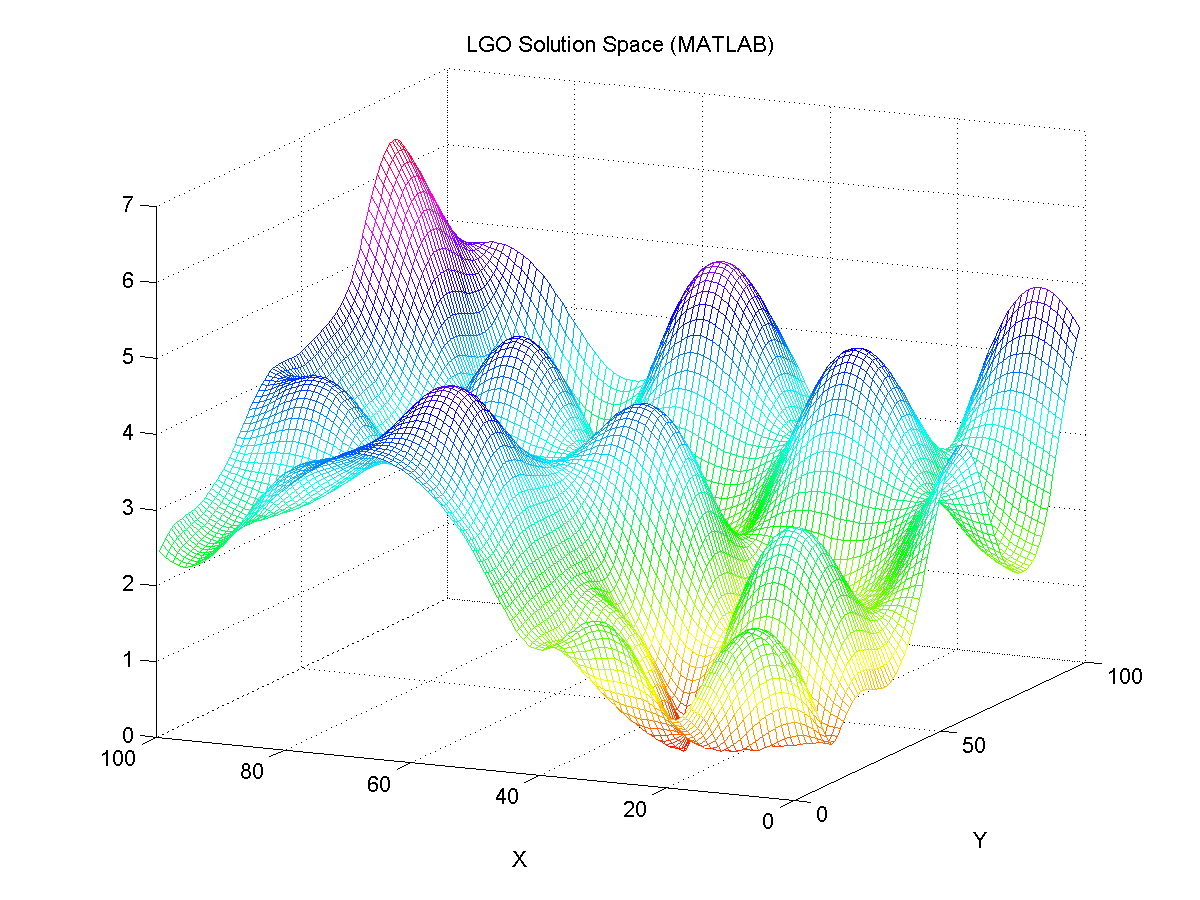
to the image in this link: http://www.gams.com/solvers/matlab.gif ? If this
cannot be accomplished with the *plot_wireframe* function, is there an
alternative method for creating 3D meshes that can have a color gradient?
Additionally, the tick labels on the 3D plots i am making intersect with the
frame of the plotting area.  Is there a way to add more space between the
plotting area and these ticks to clean up the image?

Thanks for your help,

ryan
-------------------------------------------------------------------------
This SF.Net email is sponsored by the Moblin Your Move Developer's challenge
Build the coolest Linux based applications with Moblin SDK & win great prizes
Grand prize is a trip for two to an Open Source event anywhere in the world
http://moblin-contest.org/redirect.php?banner_id=100&url=/
_______________________________________________
Matplotlib-users mailing list
[email protected]
https://lists.sourceforge.net/lists/listinfo/matplotlib-users