Hi,

you can create your supporting points on a regular r, phi grid and
transform them then to cartesian coordinates:
from mpl_toolkits.mplot3d import Axes3D
import matplotlib
import numpy as np
from matplotlib import cm
from matplotlib import pyplot as plt
step = 0.04
maxval = 1.0
fig = plt.figure()
ax = Axes3D(fig)
# create supporting points in polar coordinates
r = np.linspace(0,1.25,50)
p = np.linspace(0,2*np.pi,50)
R,P = np.meshgrid(r,p)
# transform them to cartesian system
X,Y = R*np.cos(P),R*np.sin(P)
Z = ((R**2 - 1)**2)
ax.plot_surface(X, Y, Z, rstride=1, cstride=1, cmap=cm.jet)
ax.set_zlim3d(0, 1)
ax.set_xlabel(r'$\phi_\mathrm{real}$')
ax.set_ylabel(r'$\phi_\mathrm{im}$')
ax.set_zlabel(r'$V(\phi)$')
ax.set_xticks([])
plt.show()
hth
Armin
klukas schrieb:
> I'm guessing this is currently impossible with the current mplot3d
> functionality, but I was wondering if there was any way I could generate a
> 3d graph with r, phi, z coordinates rather than x, y, z?
>
> The point is that I want to make a figure that looks like the following:
> http://upload.wikimedia.org/wikipedia/commons/7/7b/Mexican_hat_potential_polar.svg
>
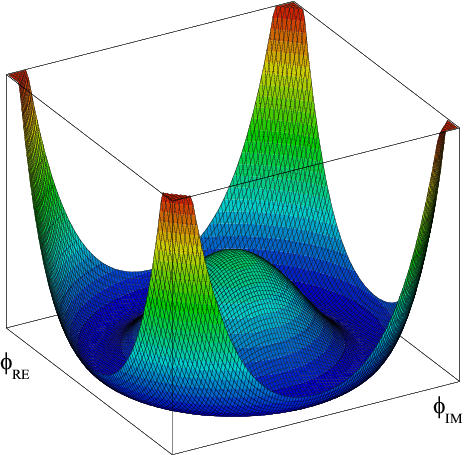
> Using the x, y, z system, I end up with something that has long tails like
> this:
> http://upload.wikimedia.org/wikipedia/commons/4/44/Mecanismo_de_Higgs_PH.png
>
> If I try to artificially cut off the data beyond some radius, I end up with
> jagged edges that are not at all visually appealing.
>
> I would appreciate any crazy ideas you can come up with.
>
> Thanks,
> Jeff
>
> P.S. Code to produce the ugly jaggedness is included below:
>
> -------------------------------------------------------
> from mpl_toolkits.mplot3d import Axes3D
> import matplotlib
> import numpy as np
> from matplotlib import cm
> from matplotlib import pyplot as plt
>
> step = 0.04
> maxval = 1.0
> fig = plt.figure()
> ax = Axes3D(fig)
> X = np.arange(-maxval, maxval, step)
> Y = np.arange(-maxval, maxval, step)
> X, Y = np.meshgrid(X, Y)
> R = np.sqrt(X**2 + Y**2)
> Z = ((R**2 - 1)**2) * (R < 1.25)
> ax.plot_surface(X, Y, Z, rstride=1, cstride=1, cmap=cm.jet)
> ax.set_zlim3d(0, 1)
> #plt.setp(ax.get_xticklabels(), visible=False)
> ax.set_xlabel(r'$\phi_\mathrm{real}$')
> ax.set_ylabel(r'$\phi_\mathrm{im}$')
> ax.set_zlabel(r'$V(\phi)$')
> ax.set_xticks([])
> plt.show()
>
--
Armin Moser
Institute of Solid State Physics
Graz University of Technology
Petersgasse 16
8010 Graz
Austria
Tel.: 0043 316 873 8477
------------------------------------------------------------------------------
Download Intel® Parallel Studio Eval
Try the new software tools for yourself. Speed compiling, find bugs
proactively, and fine-tune applications for parallel performance.
See why Intel Parallel Studio got high marks during beta.
http://p.sf.net/sfu/intel-sw-dev
_______________________________________________
Matplotlib-users mailing list
[email protected]
https://lists.sourceforge.net/lists/listinfo/matplotlib-users