Hello all,

I feel like this is possible but I am having trouble figuring it out.
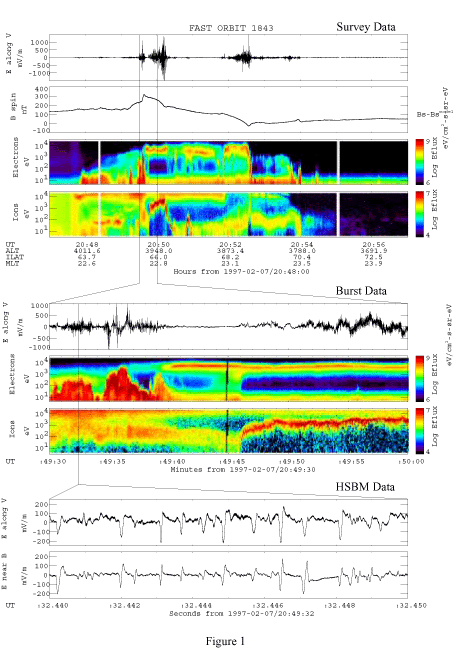
I want to put extra labels on the ticks on the xaxis like in the upper panel of
the figure
http://sprg.ssl.berkeley.edu/fast/graphics/socfig1.gif

Following
http://matplotlib.sourceforge.net/examples/axes_grid/demo_parasite_axes2.html
doesn't seem to be the right thing.

It seems that I can get the tick values from
ax= gca()
ax.get_xticks()

and from here do the calculations on what the other labels should be
(interpolate the spacecraft position).

but then how do a create another row of labels with the values that compute?
For some reason
ax.get_xmajorticklabels()[0].get_text() returns ''

Thanks much,

Brian


--

Brian A. Larsen
Space Science and Applications
Group ISR-1
Los Alamos National Laboratory
PO Box 1663, MS-D466
Los Alamos, NM 87545
USA

(For overnight add:
SM-30, Bikini Atoll Road)

Phone: 505-665-7691
Fax:   505-665-7395
email: [email protected]

Correspondence /
Technical data or Software Publicly Available
------------------------------------------------------------------------------
Start uncovering the many advantages of virtual appliances
and start using them to simplify application deployment and
accelerate your shift to cloud computing
http://p.sf.net/sfu/novell-sfdev2dev
_______________________________________________
Matplotlib-users mailing list
[email protected]
https://lists.sourceforge.net/lists/listinfo/matplotlib-users