Hello,
I have found
http://matplotlib.sourceforge.net/plot_directive/mpl_examples/pylab_examples/histogram_demo_extended_05.hires.png
http://matplotlib.sourceforge.net/plot_directive/mpl_examples/pylab_examples/histogram_demo_extended.py
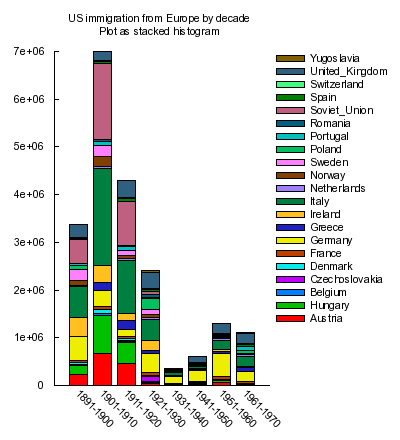
How is it possible to the following draw stacked bar charts with number
in the chart:
http://www.jpowered.com/php-scripts/stacked-bar-chart.htm
http://gnuplot.sourceforge.net/demo_4.2/showcase_plot.png

Thank you in advance.


------------------------------------------------------------------------------
Doing More with Less: The Next Generation Virtual Desktop
What are the key obstacles that have prevented many mid-market businesses
from deploying virtual desktops?   How do next-generation virtual desktops
provide companies an easier-to-deploy, easier-to-manage and more affordable
virtual desktop model.http://www.accelacomm.com/jaw/sfnl/114/51426474/
_______________________________________________
Matplotlib-users mailing list
[email protected]
https://lists.sourceforge.net/lists/listinfo/matplotlib-users