The matplotlib function contourf() should do what you want. Have a look at
this example:
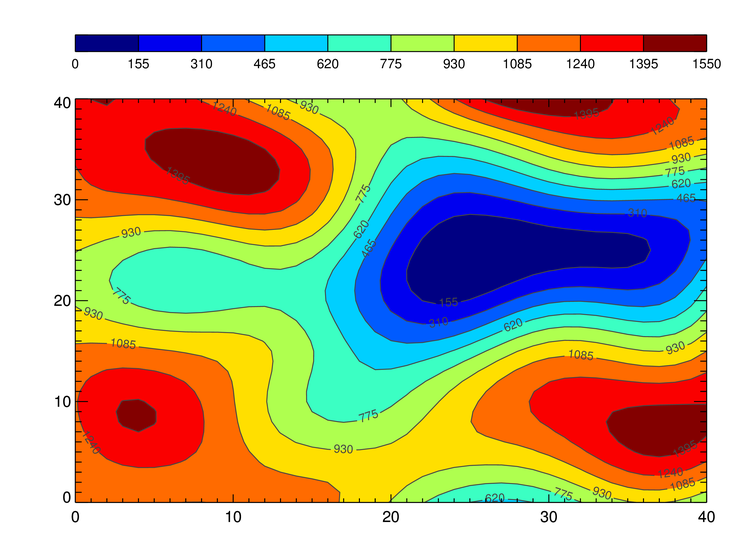
http://matplotlib.org/examples/pylab_examples/contourf_demo.html
I apologize if it is not what you're looking for. I haven't read your whole
script, because it is not *a minimal working example* (http://www.sscce.org/)
and I'm not going to do your homework. If, after having tried contourf, you
find a bug or an explained feature, please do post again.


2014-03-15 19:06 GMT+01:00 sweep <[email protected]>:

> Hi, im trying to create a heatmap/colourmap/contour style plot similar to
> http://www.idlcoyote.com/cg_tips/outcontourbar.png but I cant seem to get
> it
> working correctly. The code takes a number of parameters on the command
> line
> because it is passed by an external PHP script. Essentially its a list of
> lat/lon/values which I want to interpolate and plot but I cant get anything
> like the image above, I cant get the vmin/vmax to work for the colorbar and
> I dont know why the whole plot is squared off rather than fading to white
> if
> you see what I mean
>
> import os
> import tempfile
> import math
> os.environ['MPLCONFIGDIR'] = tempfile.mkdtemp()
> import argparse
> import numpy as np
> import matplotlib
> matplotlib.use('Agg')
> import matplotlib.pyplot as plt
> import scipy.interpolate
>
> width = 800
> height = 600
>
> lat_min = []
> lon_min = []
> lat_max = []
> lon_max = []
>
> # assumes lat is y, lon is x, and image is 800x600
> def latToXY(lat):
>         global width, height, lat_min, lat_max
>         y = ((lat - lat_min) / (lat_max - lat_min)) * height
>         #print y
>         return y
>
> def lonToXY(lon):
>         global width, height, lon_min, lon_max
>         lon = math.fabs(lon)
>         x = ((lon - lon_min) / (lon_max - lon_min)) * width
>         #print x
>         return x
>
> def scipy_idw(x, y, z, xi, yi):
>     #interp = scipy.interpolate.Rbf(x, y, z, function='linear')
>     interp = scipy.interpolate.Rbf(x, y, z)
>     return interp(xi, yi)
>
> def plot(x,y,z,grid,legend_min,legend_max,filename):
>     plt.figure()
>     fig = plt.imshow(grid, vmin=legend_min, vmax=legend_max, extent=[0,
> 1024, 0, 768])
>     fig.axes.get_xaxis().set_visible(False) # hide axis labels
>     fig.axes.get_yaxis().set_visible(False)
>     #plt.hold(True)
>     plt.scatter(x,y,c=z)
>     plt.colorbar()
>     plt.savefig(filename)
>
> # grab all floats from command line
> parser = argparse.ArgumentParser()
> parser.add_argument('--l1', type=str)
> parser.add_argument('--l2', type=str)
> parser.add_argument('--l3', type=str)
> parser.add_argument('--min', type=str)
> parser.add_argument('--max', type=str)
> parser.add_argument('--filename', type=str)
> args = parser.parse_args()
>
> # create a list by splitting at the comma
> l1_list = args.l1.split(',') # ['1','2','3','4']
> l2_list = args.l2.split(',')
> l3_list = args.l3.split(',')
>
> legend_min = float(args.min)
> legend_max = float(args.max)
> filename = args.filename
>
> # convert string list to list of floats
> for i in range(len(l1_list)):
>         l1_list[i] = float(l1_list[i])
>         l2_list[i] = float(l2_list[i])
>         l3_list[i] = float(l3_list[i])
>
> lat_min = min( math.fabs(yy) for yy in l2_list )
> lat_max = max( math.fabs(yy) for yy in l2_list )
> lon_min = min( math.fabs(xx) for xx in l1_list )
> lon_max = max( math.fabs(xx) for xx in l1_list )
>
> # convert list of floats to x,y
> for i in range(len(l1_list)):
>         l1_list[i] = lonToXY(l1_list[i])
>         l2_list[i] = latToXY(l2_list[i])
>
> # convert list to numpy array
> x = np.array(l1_list)
> y = np.array(l2_list)
> z = np.array(l3_list)
>
> #print x
> #print y
> #print z
> nx, ny = 50, 50
> xi, yi = np.linspace(x.min(), x.max(), nx), np.linspace(y.min(), y.max(),
> ny)
> xi, yi = np.meshgrid(xi, yi)
> xi, yi = xi.flatten(), yi.flatten()
>
> grid2 = scipy_idw(x,y,z,xi,yi)
> grid2 = grid2.reshape((ny, nx))
>
> plot(x,y,z,grid2,legend_min,legend_max,filename)
>
> I call the script with the following parameters:
>
> plot.py --l1=-1.8791363,-1.8786206,-1.8796862,-1.878171
> --l2=57.458459,57.458153,57.458495,57.458036 --l3=42.3,37.8,43.5,47.7
> --min=0 --max=100 --filename=/tmp/plot.png
>
>
>
> Any help is greatly appreciated
>
> Thanks
>
>
>
> --
> View this message in context:
> http://matplotlib.1069221.n5.nabble.com/matplolib-imshow-contour-heatmap-tp43078.html
> Sent from the matplotlib - users mailing list archive at Nabble.com.
>
>
> ------------------------------------------------------------------------------
> Learn Graph Databases - Download FREE O'Reilly Book
> "Graph Databases" is the definitive new guide to graph databases and their
> applications. Written by three acclaimed leaders in the field,
> this first edition is now available. Download your free book today!
> http://p.sf.net/sfu/13534_NeoTech
> _______________________________________________
> Matplotlib-users mailing list
> [email protected]
> https://lists.sourceforge.net/lists/listinfo/matplotlib-users
>
------------------------------------------------------------------------------
Learn Graph Databases - Download FREE O'Reilly Book
"Graph Databases" is the definitive new guide to graph databases and their
applications. Written by three acclaimed leaders in the field,
this first edition is now available. Download your free book today!
http://p.sf.net/sfu/13534_NeoTech
_______________________________________________
Matplotlib-users mailing list
[email protected]
https://lists.sourceforge.net/lists/listinfo/matplotlib-users