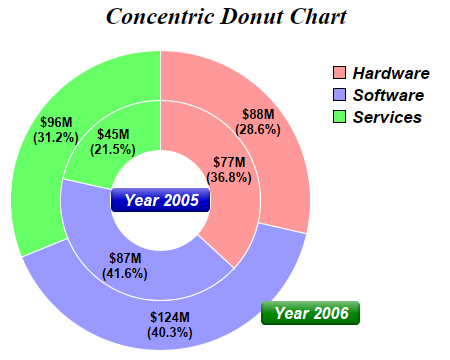
On 5/16/2014 7:51 AM, 不坏阿峰 wrote:
> how to use matplotlib to drew chart like this ?
> http://www.advsofteng.com/doc/cdpydoc/images/concentric.png
Not an answer to your question:
http://www.businessinsider.com/pie-charts-are-the-worst-2013-6

fwiw,
Alan Isaac


------------------------------------------------------------------------------
"Accelerate Dev Cycles with Automated Cross-Browser Testing - For FREE
Instantly run your Selenium tests across 300+ browser/OS combos.
Get unparalleled scalability from the best Selenium testing platform available
Simple to use. Nothing to install. Get started now for free."
http://p.sf.net/sfu/SauceLabs
_______________________________________________
Matplotlib-users mailing list
[email protected]
https://lists.sourceforge.net/lists/listinfo/matplotlib-users