If you supply the code you did to get where you got, I have a rough idea
how to get what you need. Essentially, you need to set the edgecolor of the
panes, I think. I have to dig a bit in the code to see how to do that,
though.
Cheers!
Ben Root
On Thu, Jun 26, 2014 at 7:42 PM, Dawes, Andrew M. <[email protected]>
wrote:
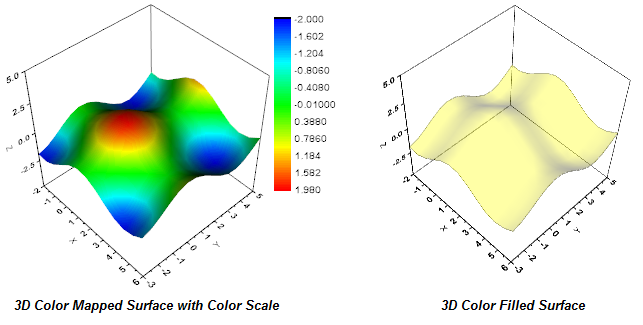
> I’m trying to plot a 3d surface with a box frame around both sides (see
> example in the following link)
>
> comparable example:
> http://cloud.originlab.com/www/products/images2/3DGraph_ColorSurface.png
>
> I made the axis panes white and disabled the grid which gets me 80% of
> the way. I don’t see anything obvious for showing additional axis lines to
> make the rest of the box (if such an option exists).
>
> Any suggestions/hacks are welcome!
>
> Thanks, Andy
>
>
> --
> Andrew M.C. Dawes
> Associate Professor of Physics
> Pacific University
> amcdawes.com
>
>
> ------------------------------------------------------------------------------
> Open source business process management suite built on Java and Eclipse
> Turn processes into business applications with Bonita BPM Community Edition
> Quickly connect people, data, and systems into organized workflows
> Winner of BOSSIE, CODIE, OW2 and Gartner awards
> http://p.sf.net/sfu/Bonitasoft
> _______________________________________________
> Matplotlib-users mailing list
> [email protected]
> https://lists.sourceforge.net/lists/listinfo/matplotlib-users
>
>
------------------------------------------------------------------------------
Open source business process management suite built on Java and Eclipse
Turn processes into business applications with Bonita BPM Community Edition
Quickly connect people, data, and systems into organized workflows
Winner of BOSSIE, CODIE, OW2 and Gartner awards
http://p.sf.net/sfu/Bonitasoft
_______________________________________________
Matplotlib-users mailing list
[email protected]
https://lists.sourceforge.net/lists/listinfo/matplotlib-users