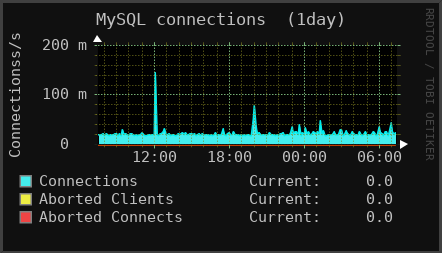
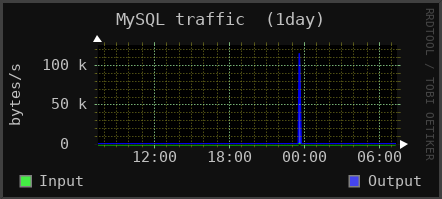
Hi Thomas,

You can get an individual graph just using the same URL from the
statistics page:
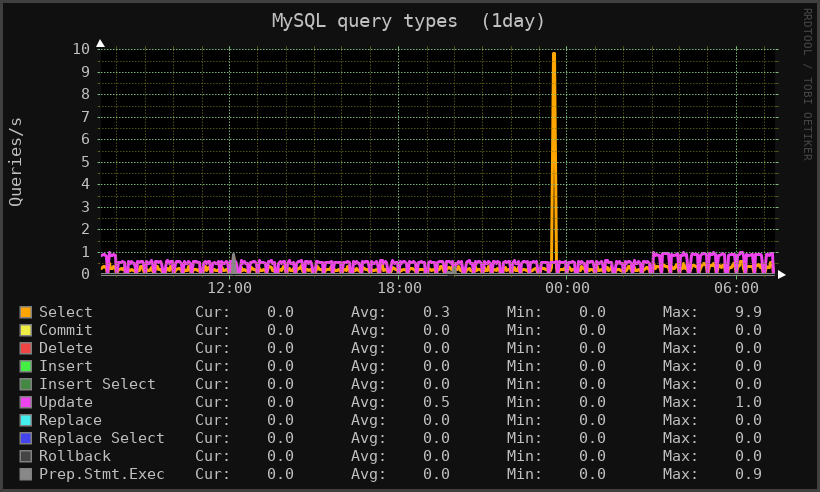
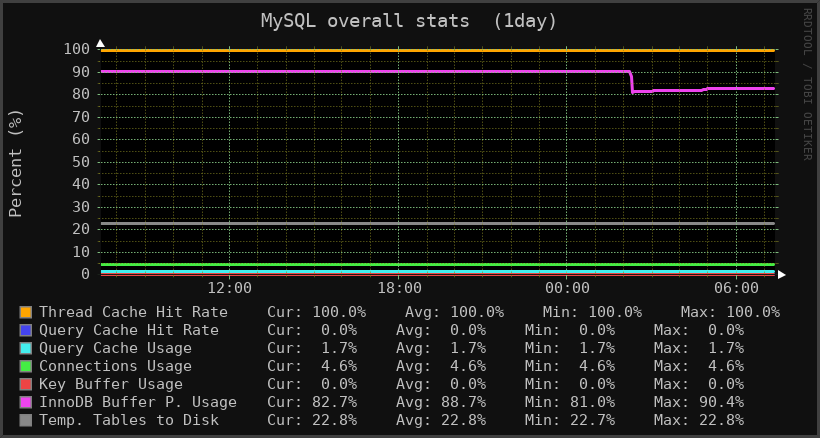
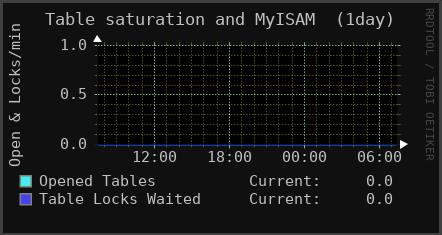
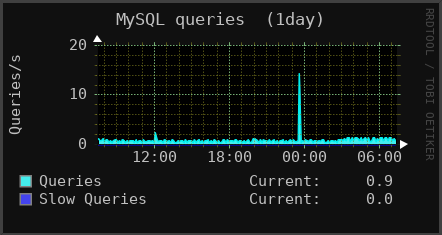
http://www.fibranet.cat/monitorix/imgs/mysql01.1day.png
http://www.fibranet.cat/monitorix/imgs/mysql02.1day.png
http://www.fibranet.cat/monitorix/imgs/mysql03.1day.png
http://www.fibranet.cat/monitorix/imgs/mysql04.1day.png
http://www.fibranet.cat/monitorix/imgs/mysql05.1day.png
http://www.fibranet.cat/monitorix/imgs/mysql06.1day.png

In order to make sure that you are getting updated graphs you must
execute the cgi either using a browser:

http://www.fibranet.cat/monitorix-cgi/monitorix.cgi?mode=localhost&graph=_mysql1&when=1day&color=black

or directly from the command line:

# (cd /var/lib/monitorix/www/cgi ; ./monitorix.cgi mode=localhost
graph=_mysql1 when=1day color=black)

Regards.


On 05/28/2014 09:42 AM, Thomas Trepper wrote:
> Hi all,
>
> I was wondering if it would be possible to „link“ to individual graphs, e.g.
> the MySQL graph only to include/embedd this one only into a custom admin
> dashboard?
>
> Thanks in advance,
>
> Thomas
>

--
Jordi Sanfeliu
FIBRANET Network Services Provider
http://www.fibranet.cat


------------------------------------------------------------------------------
Time is money. Stop wasting it! Get your web API in 5 minutes.
www.restlet.com/download
http://p.sf.net/sfu/restlet
_______________________________________________
Monitorix-general mailing list
[email protected]
https://lists.sourceforge.net/lists/listinfo/monitorix-general