c591762009 opened a new issue, #8243:
URL: https://github.com/apache/apisix/issues/8243
### Description 存在一个问题,在使用prometheus插件时,我会发现apisix_nginx_http_current_connections这个指标,中state为waiting和active的值有时候一样多。这是为啥?因为本身该服务未对外使用,调用量会随之上升。如果是apisix与prometheus交互我可以理解总量的上升。但是等待量与活动量几乎要持平了,这是为何 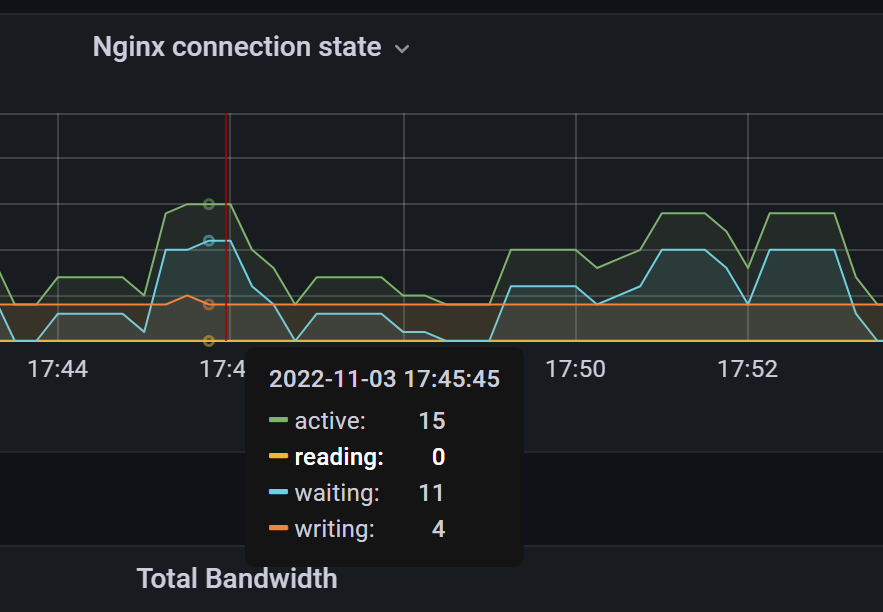 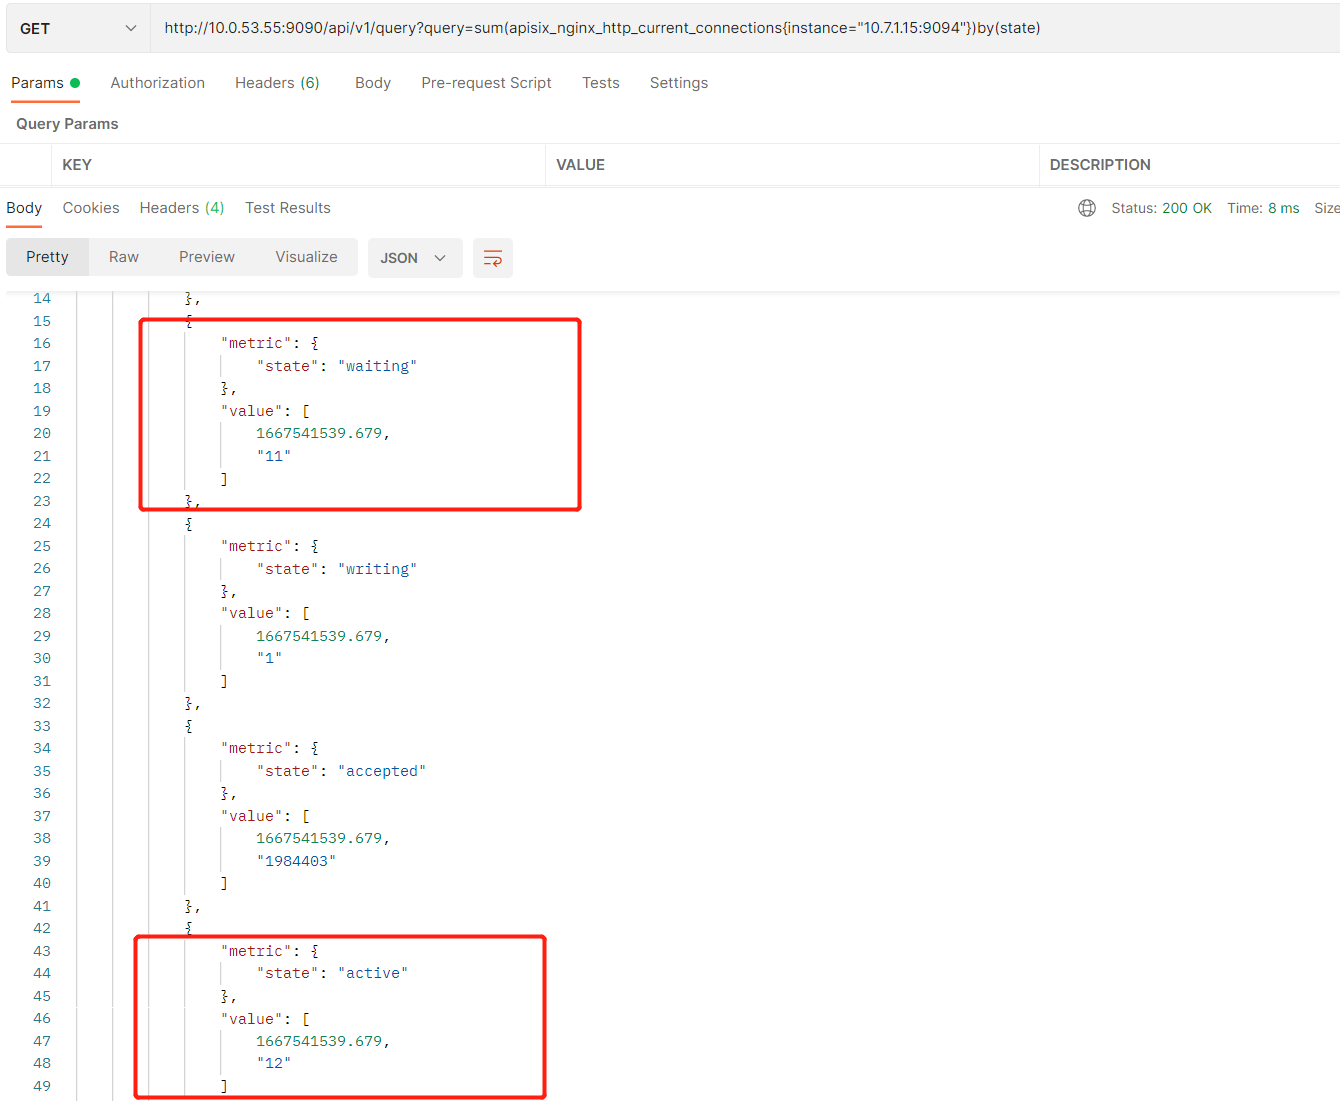 ### Environment - APISIX version (run `apisix version`): 2.13 - Operating system (run `uname -a`): - OpenResty / Nginx version (run `openresty -V` or `nginx -V`): - etcd version, if relevant (run `curl http://127.0.0.1:9090/v1/server_info`): - APISIX Dashboard version, if relevant: - Plugin runner version, for issues related to plugin runners: - LuaRocks version, for installation issues (run `luarocks --version`): -- This is an automated message from the Apache Git Service. To respond to the message, please log on to GitHub and use the URL above to go to the specific comment. To unsubscribe, e-mail: [email protected] For queries about this service, please contact Infrastructure at: [email protected]