This is an automated email from the ASF dual-hosted git repository.

guoqi pushed a commit to branch master
in repository https://gitbox.apache.org/repos/asf/apisix-website.git
The following commit(s) were added to refs/heads/master by this push:
new 8d71e48c8cb docs: add how to scale application elastically in
kubernetes (#1511)
8d71e48c8cb is described below
commit 8d71e48c8cbc4d832184790024329780b5d2635b
Author: 长龙 <[email protected]>
AuthorDate: Fri Mar 17 09:42:22 2023 +0800
docs: add how to scale application elastically in kubernetes (#1511)
---
...-scale-application-elastically-in-kubernetes.md | 310 +++++++++++++++++++++
1 file changed, 310 insertions(+)
diff --git
a/blog/zh/blog/2023/02/21/how-to-scale-application-elastically-in-kubernetes.md
b/blog/zh/blog/2023/02/21/how-to-scale-application-elastically-in-kubernetes.md
new file mode 100644
index 00000000000..7d6b91f923d
--- /dev/null
+++
b/blog/zh/blog/2023/02/21/how-to-scale-application-elastically-in-kubernetes.md
@@ -0,0 +1,310 @@
+---
+title: "如何使用 Kubernetes 实现应用程序的弹性伸缩"
+authors:
+ - name: "张晋涛"
+ title: "Author"
+ url: "https://github.com/tao12345666333";
+ image_url: "https://github.com/tao12345666333.png";
+keywords:
+- APISIX Ingress
+- Ingress
+- Ingress Controller
+- 云原生
+- Kubernetes
+- Gateway API
+description: 本篇文章利用 KEDA 使用 Prometheus 采集 APISIX
暴露出来的指标作为伸缩器,进而实现基于流量的应用程序弹性伸缩。
+tags: [Ecosystem]
+---
+
+> 本篇文章利用 KEDA 使用 Prometheus 采集 APISIX 暴露出来的指标作为伸缩器,进而实现基于流量的应用程序弹性伸缩。
+
+<!--truncate-->
+
+> 作者[张晋涛](https://github.com/tao12345666333),API7.ai 云原生工程师,Apache APISIX PMC。
+
+## 介绍
+
+通常情况下,每个应用可以承载的压力都是固定的,我们可以通过提前进行压测来了解单应用程序副本的负载能力。如果在业务高峰,或者业务的请求压力增加时候,对应用进行横向扩容可以保证更好的为用户提供服务。
+
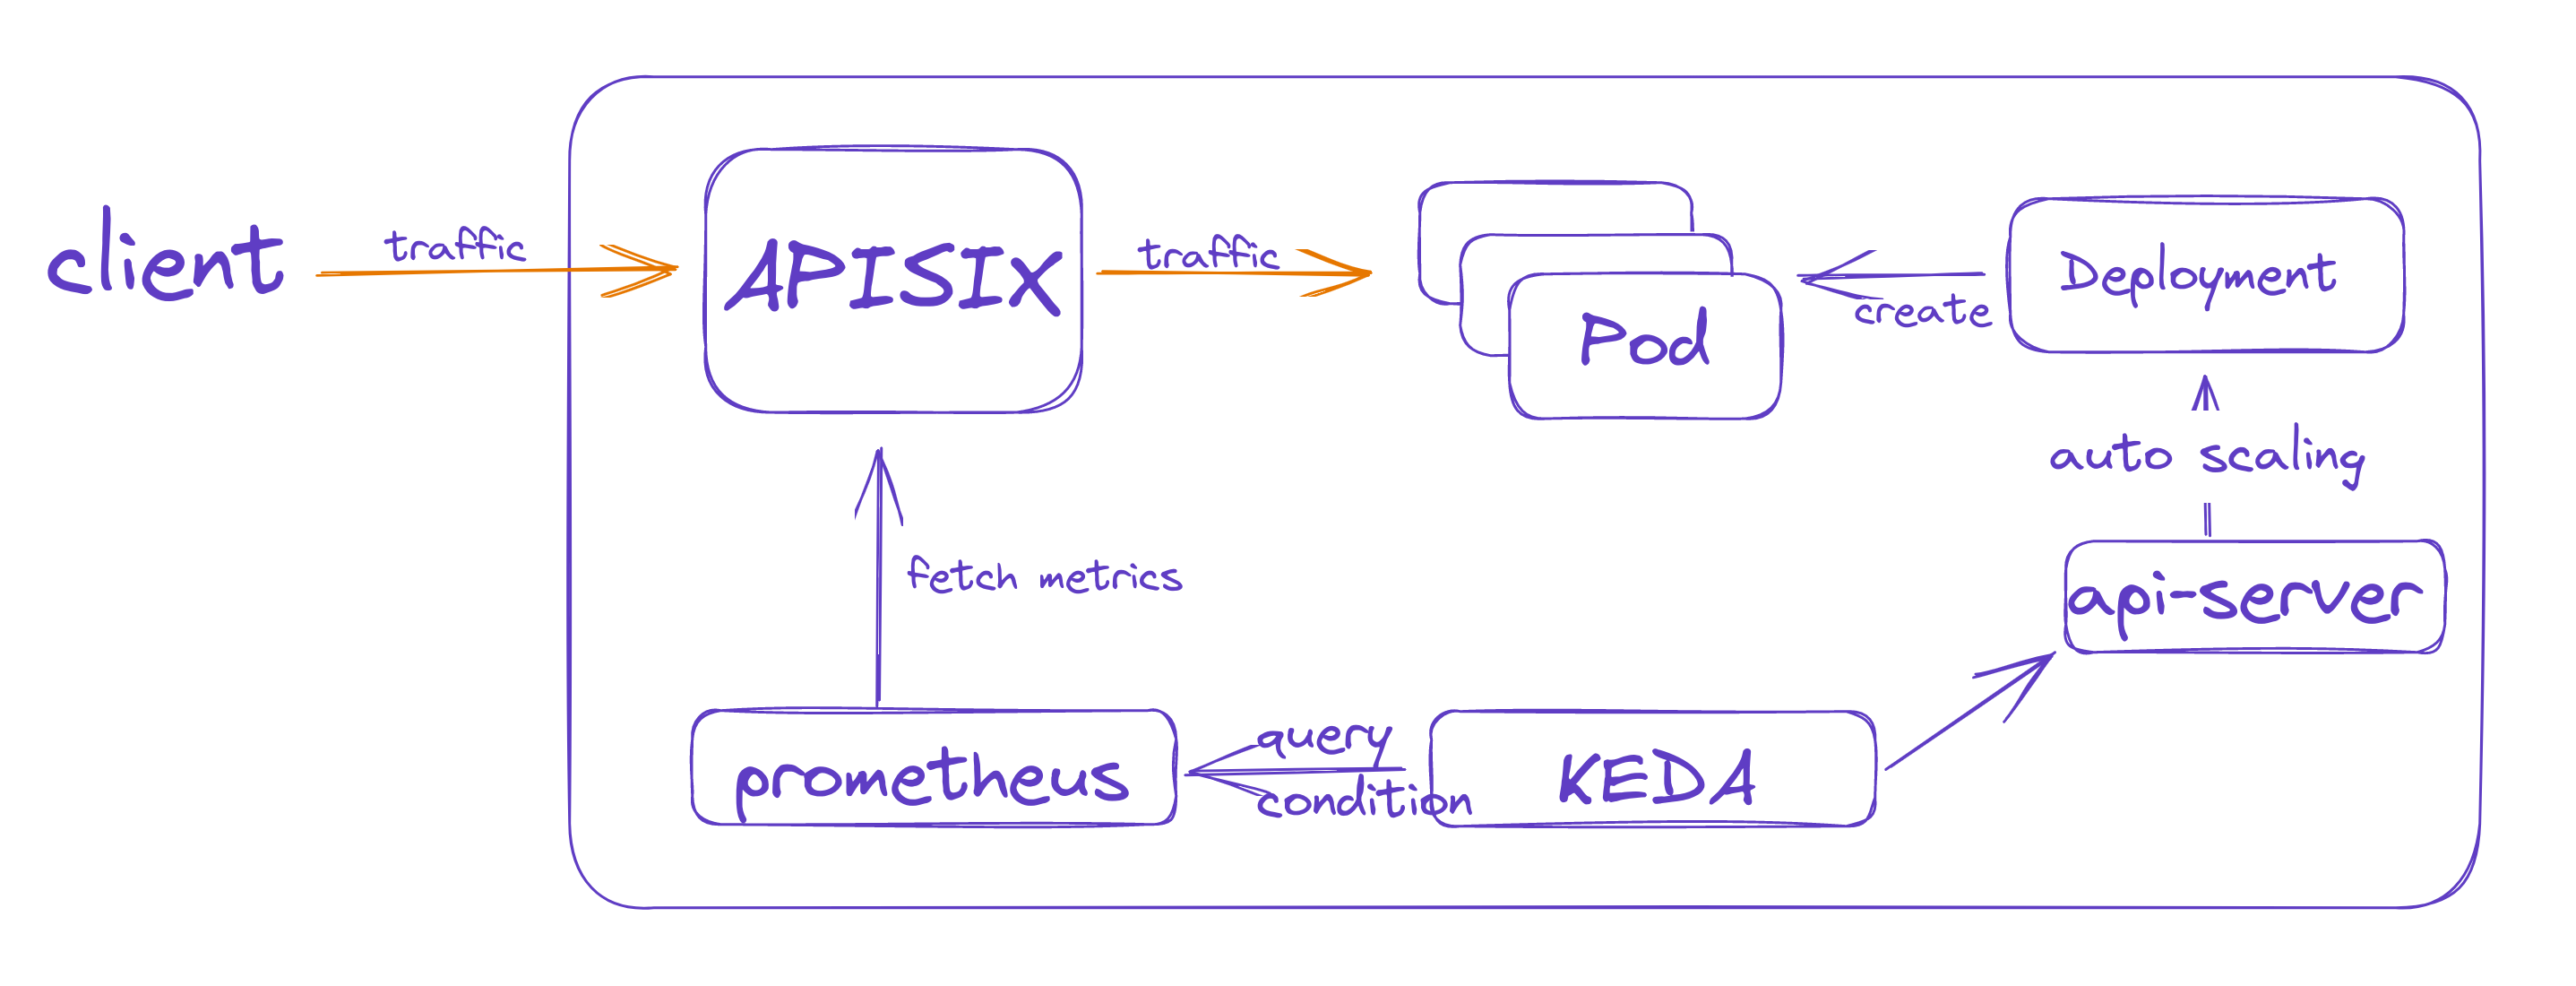
+Apache APISIX 是一个高性能的云原生 API 网关,所有发送到上游应用程序的流量都将通过 APISIX,所以我们可以根据 APISIX
提供的流量指标,来判断应用程序是否需要进行弹性伸缩。
+
+本文中将使用 KEDA 作为弹性伸缩的控制组件,用 Prometheus 采集 APISIX 提供的流量指标来进行应用的弹性伸缩。
+
+
+
+## KEDA 中如何使用 Prometheus 实现伸缩
+
+[KEDA](https://keda.sh/) 是一个 Kubernetes 中基于事件的自动伸缩组件,可以配置多种伸缩器。本文将使用
Prometheus 作为伸缩器 ,获取 APISIX 暴露出来的 metrics(指标)并进行应用程序的扩缩容。
+
+### 部署 KEDA
+
+KEDA 的部署比较简单,添加对应的 Helm repo 并进行安装即可。
+
+```bash
+(MoeLove) ➜ helm repo add kedacore https://kedacore.github.io/charts
+"kedacore" has been added to your repositories
+(MoeLove) ➜ helm repo update kedacore
+Hang tight while we grab the latest from your chart repositories...
+...Successfully got an update from the "kedacore" chart repository
+Update Complete. ⎈Happy Helming!⎈
+(MoeLove) ➜ helm install keda kedacore/keda --namespace keda --create-namespace
+NAME: keda
+LAST DEPLOYED: Thu Jan 19 00:01:00 2023
+NAMESPACE: keda
+STATUS: deployed
+REVISION: 1
+TEST SUITE: None
+```
+
+在安装完成后,Pod 处于 `Running` 状态,表示已经正常安装。
+
+```bash
+(MoeLove) ➜ kubectl -n keda get pods
+NAME READY STATUS RESTARTS
AGE
+keda-operator-metrics-apiserver-6d4db7dcff-ck9qg 1/1 Running 0
36s
+keda-operator-5dd4748dcd-k8jjz 1/1 Running 0
36s
+```
+
+接下来部署 Prometheus。
+
+### 部署 Prometheus
+
+此处我们使用 Prometheus Operator 来进行 Prometheus 的部署。Prometheus Operator 可以帮助我们在
Kubernetes 中快速部署 Prometheus 实例,以及通过声明式配置的方式添加监控规则。
+
+通过如下步骤完成 Prometheus Operator 的安装。
+
+```bash
+(MoeLove) ➜
https://github.com/prometheus-operator/prometheus-operator/releases/download/v0.62.0/bundle.yaml
+(MoeLove) ➜ kubectl apply --server-side -f bundle.yaml
+customresourcedefinition.apiextensions.k8s.io/alertmanagerconfigs.monitoring.coreos.com
serverside-applied
+customresourcedefinition.apiextensions.k8s.io/alertmanagers.monitoring.coreos.com
serverside-applied
+customresourcedefinition.apiextensions.k8s.io/podmonitors.monitoring.coreos.com
serverside-applied
+customresourcedefinition.apiextensions.k8s.io/probes.monitoring.coreos.com
serverside-applied
+customresourcedefinition.apiextensions.k8s.io/prometheuses.monitoring.coreos.com
serverside-applied
+customresourcedefinition.apiextensions.k8s.io/prometheusrules.monitoring.coreos.com
serverside-applied
+customresourcedefinition.apiextensions.k8s.io/servicemonitors.monitoring.coreos.com
serverside-applied
+customresourcedefinition.apiextensions.k8s.io/thanosrulers.monitoring.coreos.com
serverside-applied
+clusterrolebinding.rbac.authorization.k8s.io/prometheus-operator
serverside-applied
+clusterrole.rbac.authorization.k8s.io/prometheus-operator serverside-applied
+deployment.apps/prometheus-operator serverside-applied
+serviceaccount/prometheus-operator serverside-applied
+service/prometheus-operator serverside-applied
+```
+
+然后使用如下配置作为 Prometheus 实例的配置,然后将其应用到 Kubernetes 集群中。
+
+```yaml
+---
+apiVersion: v1
+kind: ServiceAccount
+metadata:
+ name: prometheus
+---
+apiVersion: rbac.authorization.k8s.io/v1
+kind: ClusterRole
+metadata:
+ name: prometheus
+rules:
+- apiGroups: [""]
+ resources:
+ - nodes
+ - nodes/metrics
+ - services
+ - endpoints
+ - pods
+ verbs: ["get", "list", "watch"]
+- apiGroups: [""]
+ resources:
+ - configmaps
+ verbs: ["get"]
+- apiGroups:
+ - networking.k8s.io
+ resources:
+ - ingresses
+ verbs: ["get", "list", "watch"]
+- nonResourceURLs: ["/metrics"]
+ verbs: ["get"]
+---
+apiVersion: rbac.authorization.k8s.io/v1
+kind: ClusterRoleBinding
+metadata:
+ name: prometheus
+roleRef:
+ apiGroup: rbac.authorization.k8s.io
+ kind: ClusterRole
+ name: prometheus
+subjects:
+- kind: ServiceAccount
+ name: prometheus
+ namespace: default
+---
+apiVersion: monitoring.coreos.com/v1
+kind: Prometheus
+metadata:
+ name: prometheus
+spec:
+ serviceAccountName: prometheus
+ serviceMonitorSelector:
+ matchLabels:
+ app: apisix
+ serviceMonitorNamespaceSelector:
+ matchLabels:
+ team: apisix
+ resources:
+ requests:
+ memory: 400Mi
+ enableAdminAPI: false
+---
+apiVersion: v1
+kind: Service
+metadata:
+ name: prometheus
+spec:
+ type: LoadBalancer
+ ports:
+ - name: web
+ port: 9090
+ protocol: TCP
+ targetPort: web
+ selector:
+ prometheus: prometheus
+```
+
+应用后,则可以看到在 `default` namespace 下创建了 Prometheus 实例。由于上述配置中创建了 `LoadBalancer`
类型的 Service,所以可以直接通过 LoadBalancer 的公网 IP 进行 Prometheus 的访问。
+
+```bash
+(MoeLove) ➜ kubectl get svc
+NAME TYPE CLUSTER-IP EXTERNAL-IP PORT(S)
AGE
+kubernetes ClusterIP 10.43.0.1 <none> 443/TCP
96m
+prometheus-operator ClusterIP None <none> 8080/TCP
92m
+prometheus-operated ClusterIP None <none> 9090/TCP
41m
+prometheus LoadBalancer 10.43.125.194 216.6.66.66
9090:30099/TCP 41m
+```
+
+## 如何部署网关并开启监控
+
+接下来部署 APISIX Ingress,并使用 Prometheus 进行 metrics 采集。
+
+**如果用户没有使用 APISIX Ingress,而是仅仅使用了 APISIX,操作方法也是类似的。** 这里不再分开介绍。
+
+此处使用 Helm 进行部署,可以同时将 APISIX Ingress controller 和 APISIX 部署到集群中。
+
+```bash
+(MoeLove) ➜ helm repo add apisix https://charts.apiseven.com
+"apisix" already exists with the same configuration, skipping
+(MoeLove) ➜ helm repo update apisix
+Hang tight while we grab the latest from your chart repositories...
+...Successfully got an update from the "apisix" chart repository
+Update Complete. ⎈Happy Helming!⎈
+(MoeLove) ➜ helm upgrade --install apisix apisix/apisix --create-namespace
--namespace apisix --set gateway.type=LoadBalancer --set
ingress-controller.enabled=true --set
ingress-controller.config.apisix.serviceNamespace=apisix
+Release "apisix" has been upgraded. Happy Helming!
+NAME: apisix
+LAST DEPLOYED: Thu Jan 19 02:11:23 2023
+NAMESPACE: apisix
+STATUS: deployed
+REVISION: 1
+TEST SUITE: None
+NOTES:
+1. Get the application URL by running these commands:
+ NOTE: It may take a few minutes for the LoadBalancer IP to be available.
+ You can watch the status of by running 'kubectl get --namespace
apisix svc -w apisix-gateway'
+ export SERVICE_IP=$(kubectl get svc --namespace apisix apisix-gateway
--template "{{ range (index .status.loadBalancer.ingress 0) }}{{.}}{{ end }}")
+ echo http://$SERVICE_IP:80
+```
+
+接下来开启 APISIX 的 `prometheus` 插件,具体的配置方法和相关参数可以参考如下两篇文档。
+
+* [prometheus plugins | Apache
APISIX®](https://apisix.apache.org/docs/apisix/plugins/prometheus/)
+* [How to access Apache APISIX Prometheus metrics on Kubernetes | Apache
APISIX®](https://apisix.apache.org/docs/ingress-controller/tutorials/how-to-access-Apache-APISIX-Prometheus-Metrics-on-k8s/)
+
+开启后,便可以通过创建 ServiceMonitor 资源,让 Prometheus 抓取 APISIX 暴露出的 metrics 了。
+
+```yaml
+apiVersion: monitoring.coreos.com/v1
+kind: ServiceMonitor
+metadata:
+ name: example-app
+ labels:
+ app: apisix
+spec:
+ selector:
+ matchLabels:
+ app: apisix
+ endpoints:
+ - port: web
+```
+
+## 验证应用弹性伸缩能力
+
+此处将创建一个示例应用。
+
+```bash
+(MoeLove) ➜ kubectl create deploy httpbin --image=kennethreitz/httpbin
--port=80
+deployment.apps/httpbin created
+(MoeLove) ➜ kubectl expose deploy httpbin --port 80
+```
+
+创建如下路由规则,应用到 Kubernetes 集群后,则可通过 APISIX 进行请求的代理。
+
+```yaml
+apiVersion: apisix.apache.org/v2
+kind: ApisixRoute
+metadata:
+ name: httpserver-route
+spec:
+ http:
+ - name: rule1
+ match:
+ hosts:
+ - local.httpbin.org
+ paths:
+ - /*
+ backends:
+ - serviceName: httpbin
+ servicePort: 80
+```
+
+接下来,创建 KEDA 的 ScaledObject,配置 Prometheus 相关参数。
+
+```yaml
+apiVersion: keda.sh/v1alpha1
+kind: ScaledObject
+metadata:
+ name: prometheus-scaledobject
+ namespace: default
+spec:
+ scaleTargetRef:
+ name: httpbin
+ triggers:
+ - type: prometheus
+ metadata:
+ serverAddress: http://prometheus.default.svc:9090
+ metricName: apisix_http_status
+ threshold: '10'
+ query: sum(rate(apisix_http_status{route="httpserver-route"}[1m]))
+```
+
+上述参数表示通过 `sum(rate(apisix_http_status{route="httpserver-route"}[1m]))`
作为查询表达式,如果结果能到达 10, 则开始进行扩容(此处配置仅用于本文中的示例使用,生产环境请按照实际情况进行修改)。
+
+然后,我们通过 curl 向 httpbin 服务发出连续请求,再次查看示例应用的 Pod 已经变成两个,证明 KEDA 成功自动扩容了。
+
+```bash
+(MoeLove) ➜ kubectl get pods
+NAME READY STATUS RESTARTS AGE
+httpbin-d46d778d7-chtdw 1/1 Running 0 12m
+httpbin-d46d778d7-xanbj 1/1 Running 0 10s
+```
+
+待一段时间无请求后,再次查看发现 Pod 的数量自动缩减为一个,证明自动缩容也实现了。
+
+```bash
+(MoeLove) ➜ kubectl get pods
+NAME READY STATUS RESTARTS AGE
+httpbin-d46d778d7-chtdw 1/1 Running 0 32m
+```
+
+## 总结
+
+本篇文章利用 KEDA 使用 Prometheus 采集 APISIX 暴露出来的指标作为伸缩器,进而实现基于流量的应用程序弹性伸缩。由于所有流量都会先经过
APISIX ,所以在 APISIX 侧进行数据统计更加简单方便。
+
+在业务请求量上来后,应用程序将进行自动化的扩容,当业务低谷的时候,则会自动的缩容。这可以在缓解很多生产环境下的手动扩/缩容操作,以保障用户的服务体验。