This is an automated email from the ASF dual-hosted git repository.

monkeydluffy pushed a commit to branch master
in repository https://gitbox.apache.org/repos/asf/apisix.git
The following commit(s) were added to refs/heads/master by this push:
new 809ba09b2 feat: Upstream status report (#9151)
809ba09b2 is described below
commit 809ba09b26ddd62e0efa612f85e90d1aa938ce02
Author: jinhua luo <[email protected]>
AuthorDate: Thu Mar 30 15:29:44 2023 +0800
feat: Upstream status report (#9151)
---
apisix/control/v1.lua | 156 +++++++++++++++++++----
apisix/plugins/prometheus/exporter.lua | 14 +++
docs/assets/images/health_check_status_page.png | Bin 0 -> 23044 bytes
docs/en/latest/control-api.md | 159 +++++++++++-------------
docs/en/latest/plugins/prometheus.md | 14 +++
docs/zh/latest/control-api.md | 159 +++++++++++-------------
docs/zh/latest/plugins/prometheus.md | 11 ++
rockspec/apisix-master-0.rockspec | 2 +-
t/control/healthcheck.t | 114 ++++++-----------
t/discovery/consul.t | 10 +-
t/discovery/consul_kv.t | 24 ++--
11 files changed, 377 insertions(+), 286 deletions(-)
diff --git a/apisix/control/v1.lua b/apisix/control/v1.lua
index fd031a473..3143ae594 100644
--- a/apisix/control/v1.lua
+++ b/apisix/control/v1.lua
@@ -14,6 +14,7 @@
-- See the License for the specific language governing permissions and
-- limitations under the License.
--
+local require = require
local core = require("apisix.core")
local plugin = require("apisix.plugin")
local get_routes = require("apisix.router").http_routes
@@ -22,6 +23,7 @@ local upstream_mod = require("apisix.upstream")
local get_upstreams = upstream_mod.upstreams
local collectgarbage = collectgarbage
local ipairs = ipairs
+local pcall = pcall
local str_format = string.format
local ngx_var = ngx.var
@@ -62,52 +64,137 @@ function _M.schema()
end
-local function extra_checker_info(value, src_type)
- local checker = value.checker
- local upstream = value.checker_upstream
- local host = upstream.checks and upstream.checks.active and
upstream.checks.active.host
- local port = upstream.checks and upstream.checks.active and
upstream.checks.active.port
- local nodes = upstream.nodes
- local healthy_nodes = core.table.new(#nodes, 0)
- for _, node in ipairs(nodes) do
- local ok = checker:get_target_status(node.host, port or node.port,
host)
- if ok then
- core.table.insert(healthy_nodes, node)
- end
+local healthcheck
+local function extra_checker_info(value)
+ if not healthcheck then
+ healthcheck = require("resty.healthcheck")
end
- local conf = value.value
+ local name = upstream_mod.get_healthchecker_name(value)
+ local nodes, err = healthcheck.get_target_list(name,
"upstream-healthcheck")
+ if err then
+ core.log.error("healthcheck.get_target_list failed: ", err)
+ end
return {
- name = upstream_mod.get_healthchecker_name(value),
- src_id = conf.id,
- src_type = src_type,
+ name = value.key,
nodes = nodes,
- healthy_nodes = healthy_nodes,
}
end
-local function iter_and_add_healthcheck_info(infos, values, src_type)
+local function get_checker_type(checks)
+ if checks.active and checks.active.type then
+ return checks.active.type
+ elseif checks.passive and checks.passive.type then
+ return checks.passive.type
+ end
+end
+
+
+local function iter_and_add_healthcheck_info(infos, values)
if not values then
return
end
for _, value in core.config_util.iterate_values(values) do
- if value.checker then
- core.table.insert(infos, extra_checker_info(value, src_type))
+ local checks = value.value.checks or (value.value.upstream and
value.value.upstream.checks)
+ if checks then
+ local info = extra_checker_info(value)
+ info.type = get_checker_type(checks)
+ core.table.insert(infos, info)
end
end
end
-function _M.get_health_checkers()
+local HTML_TEMPLATE = [[
+<html xmlns="http://www.w3.org/1999/xhtml";>
+<head>
+ <title>APISIX upstream check status</title>
+</head>
+<body>
+<h1>APISIX upstream check status</h1>
+<table style="background-color:white" cellspacing="0" cellpadding="3"
border="1">
+ <tr bgcolor="#C0C0C0">
+ <th>Index</th>
+ <th>Upstream</th>
+ <th>Check type</th>
+ <th>Host</th>
+ <th>Status</th>
+ <th>Success counts</th>
+ <th>TCP Failures</th>
+ <th>HTTP Failures</th>
+ <th>TIMEOUT Failures</th>
+ </tr>
+{% local i = 0 %}
+{% for _, stat in ipairs(stats) do %}
+{% for _, node in ipairs(stat.nodes) do %}
+{% i = i + 1 %}
+ {% if node.status == "healthy" then %}
+ <tr>
+ {% else %}
+ <tr bgcolor="#FF0000">
+ {% end %}
+ <td>{* i *}</td>
+ <td>{* stat.name *}</td>
+ <td>{* stat.type *}</td>
+ <td>{* node.ip .. ":" .. node.port *}</td>
+ <td>{* node.status *}</td>
+ <td>{* node.counter.success *}</td>
+ <td>{* node.counter.tcp_failure *}</td>
+ <td>{* node.counter.http_failure *}</td>
+ <td>{* node.counter.timeout_failure *}</td>
+ </tr>
+{% end %}
+{% end %}
+</table>
+</body>
+</html>
+]]
+
+local html_render
+
+local function try_render_html(data)
+ if not html_render then
+ local template = require("resty.template")
+ html_render = template.compile(HTML_TEMPLATE)
+ end
+ local accept = ngx_var.http_accept
+ if accept and accept:find("text/html") then
+ local ok, out = pcall(html_render, data)
+ if not ok then
+ local err = str_format("HTML template rendering: %s", out)
+ core.log.error(err)
+ return nil, err
+ end
+ return out
+ end
+end
+
+
+local function _get_health_checkers()
local infos = {}
local routes = get_routes()
- iter_and_add_healthcheck_info(infos, routes, "routes")
+ iter_and_add_healthcheck_info(infos, routes)
local services = get_services()
- iter_and_add_healthcheck_info(infos, services, "services")
+ iter_and_add_healthcheck_info(infos, services)
local upstreams = get_upstreams()
- iter_and_add_healthcheck_info(infos, upstreams, "upstreams")
+ iter_and_add_healthcheck_info(infos, upstreams)
+ return infos
+end
+
+
+function _M.get_health_checkers()
+ local infos = _get_health_checkers()
+ local out, err = try_render_html({stats=infos})
+ if out then
+ core.response.set_header("Content-Type", "text/html")
+ return 200, out
+ end
+ if err then
+ return 503, {error_msg = err}
+ end
+
return 200, infos
end
@@ -119,11 +206,15 @@ local function iter_and_find_healthcheck_info(values,
src_type, src_id)
for _, value in core.config_util.iterate_values(values) do
if value.value.id == src_id then
- if not value.checker then
+ local checks = value.value.checks or
+ (value.value.upstream and value.value.upstream.checks)
+ if not checks then
return nil, str_format("no checker for %s[%s]", src_type,
src_id)
end
- return extra_checker_info(value, src_type)
+ local info = extra_checker_info(value)
+ info.type = get_checker_type(checks)
+ return info
end
end
@@ -155,6 +246,16 @@ function _M.get_health_checker()
if not info then
return 404, {error_msg = err}
end
+
+ local out, err = try_render_html({stats={info}})
+ if out then
+ core.response.set_header("Content-Type", "text/html")
+ return 200, out
+ end
+ if err then
+ return 503, {error_msg = err}
+ end
+
return 200, info
end
@@ -372,5 +473,6 @@ return {
methods = {"GET"},
uris = {"/plugin_metadata/*"},
handler = _M.dump_plugin_metadata,
- }
+ },
+ get_health_checkers = _get_health_checkers,
}
diff --git a/apisix/plugins/prometheus/exporter.lua
b/apisix/plugins/prometheus/exporter.lua
index 45ff94c3f..1cb4a534c 100644
--- a/apisix/plugins/prometheus/exporter.lua
+++ b/apisix/plugins/prometheus/exporter.lua
@@ -17,6 +17,7 @@
local base_prometheus = require("prometheus")
local core = require("apisix.core")
local plugin = require("apisix.plugin")
+local control = require("apisix.control.v1")
local ipairs = ipairs
local pairs = pairs
local ngx = ngx
@@ -158,6 +159,10 @@ function _M.http_init(prometheus_enabled_in_stream)
"The free space of each nginx shared DICT since APISIX start",
{"name"})
+ metrics.upstream_status = prometheus:gauge("upstream_status",
+ "Upstream status from health check",
+ {"name", "ip", "port"})
+
-- per service
-- The consumer label indicates the name of consumer corresponds to the
@@ -458,6 +463,15 @@ local function collect(ctx, stream_only)
metrics.node_info:set(1, gen_arr(hostname))
+ -- update upstream_status metrics
+ local stats = control.get_health_checkers()
+ for _, stat in ipairs(stats) do
+ for _, node in ipairs(stat.nodes) do
+ metrics.upstream_status:set((node.status == "healthy") and 1 or 0,
+ gen_arr(stat.name, node.ip, node.port))
+ end
+ end
+
core.response.set_header("content_type", "text/plain")
return 200, core.table.concat(prometheus:metric_data())
end
diff --git a/docs/assets/images/health_check_status_page.png
b/docs/assets/images/health_check_status_page.png
new file mode 100644
index 000000000..ed4aebead
Binary files /dev/null and b/docs/assets/images/health_check_status_page.png
differ
diff --git a/docs/en/latest/control-api.md b/docs/en/latest/control-api.md
index c6944f2b5..a068d4411 100644
--- a/docs/en/latest/control-api.md
+++ b/docs/en/latest/control-api.md
@@ -98,71 +98,50 @@ Returns a [health check](./tutorials/health-check.md) of
the APISIX instance.
```json
[
- {
- "healthy_nodes": [
- {
- "host": "127.0.0.1",
- "port": 1980,
- "priority": 0,
- "weight": 1
- }
- ],
- "name": "upstream#/upstreams/1",
- "nodes": [
- {
- "host": "127.0.0.1",
- "port": 1980,
- "priority": 0,
- "weight": 1
- },
- {
- "host": "127.0.0.2",
- "port": 1988,
- "priority": 0,
- "weight": 1
- }
- ],
- "src_id": "1",
- "src_type": "upstreams"
- },
- {
- "healthy_nodes": [
- {
- "host": "127.0.0.1",
- "port": 1980,
- "priority": 0,
- "weight": 1
- }
- ],
- "name": "upstream#/routes/1",
- "nodes": [
- {
- "host": "127.0.0.1",
- "port": 1980,
- "priority": 0,
- "weight": 1
- },
- {
- "host": "127.0.0.1",
- "port": 1988,
- "priority": 0,
- "weight": 1
- }
- ],
- "src_id": "1",
- "src_type": "routes"
- }
+ {
+ "nodes": [
+ {
+ "ip": "52.86.68.46",
+ "counter": {
+ "http_failure": 0,
+ "success": 0,
+ "timeout_failure": 0,
+ "tcp_failure": 0
+ },
+ "port": 80,
+ "status": "healthy"
+ },
+ {
+ "ip": "100.24.156.8",
+ "counter": {
+ "http_failure": 5,
+ "success": 0,
+ "timeout_failure": 0,
+ "tcp_failure": 0
+ },
+ "port": 80,
+ "status": "unhealthy"
+ }
+ ],
+ "name": "/apisix/routes/1",
+ "type": "http"
+ }
]
+
```
Each of the returned objects contain the following fields:
-* src_type: where the health checker is reporting from. Value is one of
`["routes", "services", "upstreams"]`.
-* src_id: id of the object creating the health checker. For example, if an
Upstream
-object with id `1` creates a health checker, the `src_type` is `upstreams` and
the `src_id` is `1`.
-* name: name of the health checker.
+* name: resource id, where the health checker is reporting from.
+* type: health check type: `["http", "https", "tcp"]`.
* nodes: target nodes of the health checker.
-* healthy_nodes: healthy nodes discovered by the health checker.
+* nodes[i].ip: ip address.
+* nodes[i].port: port number.
+* nodes[i].status: health check result: `["healthy", "unhealthy",
"mostly_healthy", "mostly_unhealthy"]`.
+* nodes[i].counter.success: success health check count.
+* nodes[i].counter.http_failure: http failures count.
+* nodes[i].counter.tcp_failure: tcp connect/read/write failures count.
+* nodes[i].counter.timeout_failure: timeout count.
You can also use `/v1/healthcheck/$src_type/$src_id` to get the health status
of specific nodes.
@@ -170,40 +149,50 @@ For example, `GET /v1/healthcheck/upstreams/1` returns:
```json
{
- "healthy_nodes": [
- {
- "host": "127.0.0.1",
- "port": 1980,
- "priority": 0,
- "weight": 1
- }
- ],
- "name": "upstream#/upstreams/1",
- "nodes": [
- {
- "host": "127.0.0.1",
- "port": 1980,
- "priority": 0,
- "weight": 1
- },
- {
- "host": "127.0.0.2",
- "port": 1988,
- "priority": 0,
- "weight": 1
- }
- ],
- "src_id": "1",
- "src_type": "upstreams"
+ "nodes": [
+ {
+ "ip": "52.86.68.46",
+ "counter": {
+ "http_failure": 0,
+ "success": 2,
+ "timeout_failure": 0,
+ "tcp_failure": 0
+ },
+ "port": 80,
+ "status": "healthy"
+ },
+ {
+ "ip": "100.24.156.8",
+ "counter": {
+ "http_failure": 5,
+ "success": 0,
+ "timeout_failure": 0,
+ "tcp_failure": 0
+ },
+ "port": 80,
+ "status": "unhealthy"
+ }
+ ],
+ "type": "http"
+ "name": "/apisix/routes/1"
}
+
```
:::note
-As APISIX uses multiple-process architecture, if the process never handles the
request of a specific upstream, then the upstream's health check information
will not appear on the process. This may result in the health check API can't
get all data during testing.
+Only when one upstream is satisfied by the conditions below,
+its status is shown in the result list:
+
+* The upstream is configured with a health checker
+* The upstream has served requests in any worker process
:::
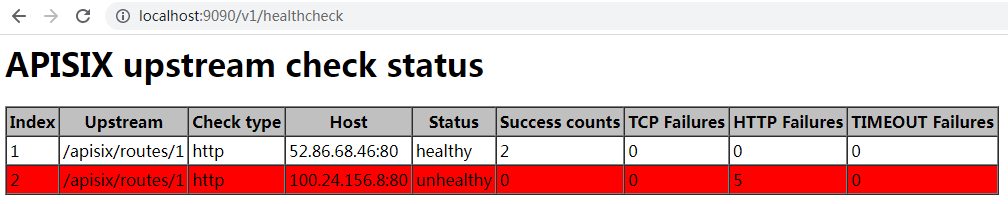
+If you use browser to access the control API URL, then you will get the HTML
output:
+
+
+
### POST /v1/gc
Introduced in [v2.8](https://github.com/apache/apisix/releases/tag/2.8).
diff --git a/docs/en/latest/plugins/prometheus.md
b/docs/en/latest/plugins/prometheus.md
index eb9ca6c83..9f93f9a24 100644
--- a/docs/en/latest/plugins/prometheus.md
+++ b/docs/en/latest/plugins/prometheus.md
@@ -235,6 +235,16 @@ The following metrics are exported by the `prometheus`
Plugin:
- Info: Information about the APISIX node.
- Shared dict: The capacity and free space of all nginx.shared.DICT in APISIX.
+- `apisix_upstream_status`: Health check result status of upstream nodes. A
value of `1` represents healthy and `0` represents unhealthy.
+
+ The available attributes are:
+
+ | Name | Description
|
+
|--------------|-------------------------------------------------------------------------------------------------------------------------------|
+ | name | resource id where the upstream node is attached to, e.g.
`/apisix/routes/1`, `/apisix/upstreams/1`.
|
+ | ip | ip address of the node. |
+ | port | port number of the node. |
+
Here are the original metrics from APISIX:
```shell
@@ -323,6 +333,10 @@
apisix_shared_dict_free_space_bytes{name="balancer-ewma-locks"} 10412032
apisix_shared_dict_free_space_bytes{name="discovery"} 1032192
apisix_shared_dict_free_space_bytes{name="etcd-cluster-health-check"} 10412032
...
+# HELP apisix_upstream_status Upstream status from health check
+# TYPE apisix_upstream_status gauge
+apisix_upstream_status{name="/apisix/routes/1",ip="100.24.156.8",port="80"} 0
+apisix_upstream_status{name="/apisix/routes/1",ip="52.86.68.46",port="80"} 1
```
## Disable Plugin
diff --git a/docs/zh/latest/control-api.md b/docs/zh/latest/control-api.md
index f257789e7..eeb61b5b8 100644
--- a/docs/zh/latest/control-api.md
+++ b/docs/zh/latest/control-api.md
@@ -96,70 +96,50 @@ APISIX 中一些插件添加了自己的 control API。如果你对他们感兴
```json
[
- {
- "healthy_nodes": [
- {
- "host": "127.0.0.1",
- "port": 1980,
- "priority": 0,
- "weight": 1
- }
- ],
- "name": "upstream#/upstreams/1",
- "nodes": [
- {
- "host": "127.0.0.1",
- "port": 1980,
- "priority": 0,
- "weight": 1
- },
- {
- "host": "127.0.0.2",
- "port": 1988,
- "priority": 0,
- "weight": 1
- }
- ],
- "src_id": "1",
- "src_type": "upstreams"
- },
- {
- "healthy_nodes": [
- {
- "host": "127.0.0.1",
- "port": 1980,
- "priority": 0,
- "weight": 1
- }
- ],
- "name": "upstream#/routes/1",
- "nodes": [
- {
- "host": "127.0.0.1",
- "port": 1980,
- "priority": 0,
- "weight": 1
- },
- {
- "host": "127.0.0.1",
- "port": 1988,
- "priority": 0,
- "weight": 1
- }
- ],
- "src_id": "1",
- "src_type": "routes"
- }
+ {
+ "nodes": [
+ {
+ "ip": "52.86.68.46",
+ "counter": {
+ "http_failure": 0,
+ "success": 0,
+ "timeout_failure": 0,
+ "tcp_failure": 0
+ },
+ "port": 80,
+ "status": "healthy"
+ },
+ {
+ "ip": "100.24.156.8",
+ "counter": {
+ "http_failure": 5,
+ "success": 0,
+ "timeout_failure": 0,
+ "tcp_failure": 0
+ },
+ "port": 80,
+ "status": "unhealthy"
+ }
+ ],
+ "name": "/apisix/routes/1",
+ "type": "http"
+ }
]
+
```
每个 entry 包含以下字段:
-* src_type:表示 health checker 的来源。值是 `[routes,services,upstreams]` 其中之一
-* src_id:表示创建 health checker 的对象的 id。例如,假设 id 为 1 的 Upstream 对象创建了一个 health
checker,那么 `src_type` 就是 `upstreams`,`src_id` 就是 1
-* name:表示 health checker 的名称
-* nodes:health checker 的目标节点
-* healthy_nodes:表示 health checker 检测到的健康节点
+* name: 资源 ID,健康检查的报告对象。
+* type: 健康检查类型,取值为 `["http", "https", "tcp"]`。
+* nodes: 检查节点列表。
+* nodes[i].ip: IP 地址。
+* nodes[i].port: 端口。
+* nodes[i].status: 状态:`["healthy", "unhealthy", "mostly_healthy",
"mostly_unhealthy"]`。
+* nodes[i].counter.success: 成功计数器。
+* nodes[i].counter.http_failure: HTTP 访问失败计数器。
+* nodes[i].counter.tcp_failure: TCP 连接或读写的失败计数器。
+* nodes[i].counter.timeout_failure: 超时计数器。
用户也可以通过 `/v1/healthcheck/$src_type/$src_id` 来获取指定 health checker 的状态。
@@ -167,40 +147,49 @@ APISIX 中一些插件添加了自己的 control API。如果你对他们感兴
```json
{
- "healthy_nodes": [
- {
- "host": "127.0.0.1",
- "port": 1980,
- "priority": 0,
- "weight": 1
- }
- ],
- "name": "upstream#/upstreams/1",
- "nodes": [
- {
- "host": "127.0.0.1",
- "port": 1980,
- "priority": 0,
- "weight": 1
- },
- {
- "host": "127.0.0.2",
- "port": 1988,
- "priority": 0,
- "weight": 1
- }
- ],
- "src_id": "1",
- "src_type": "upstreams"
+ "nodes": [
+ {
+ "ip": "52.86.68.46",
+ "counter": {
+ "http_failure": 0,
+ "success": 2,
+ "timeout_failure": 0,
+ "tcp_failure": 0
+ },
+ "port": 80,
+ "status": "healthy"
+ },
+ {
+ "ip": "100.24.156.8",
+ "counter": {
+ "http_failure": 5,
+ "success": 0,
+ "timeout_failure": 0,
+ "tcp_failure": 0
+ },
+ "port": 80,
+ "status": "unhealthy"
+ }
+ ],
+ "type": "http"
+ "name": "/apisix/routes/1"
}
+
```
:::note
-由于 APISIX 采用多进程架构,如果该进程从来没有处理特定上游的请求,则上游的健康检查信息不会出现在该进程上。这可能会导致健康检查 API
在测试期间无法获取所有数据。
+只有一个上游满足以下条件时,它的健康检查状态才会出现在结果里面:
+
+* 上游配置了健康检查。
+* 上游在任何一个 worker 进程处理过客户端请求。
:::
+如果你使用浏览器访问该 API,你将得到一个网页:
+
+
+
### POST /v1/gc
引入自 2.8 版本
diff --git a/docs/zh/latest/plugins/prometheus.md
b/docs/zh/latest/plugins/prometheus.md
index 8afc3fe65..b63d7f970 100644
--- a/docs/zh/latest/plugins/prometheus.md
+++ b/docs/zh/latest/plugins/prometheus.md
@@ -208,6 +208,13 @@ scrape_configs:
- Info: 当前 APISIX 节点信息。
- Shared dict: APISIX 中所有共享内存的容量以及剩余可用空间。
+- `apisix_upstream_status`: 上游健康检查的节点状态,`1` 表示健康,`0` 表示不健康。属性如下所示:
+
+ | 名称 | 描述
|
+
|--------------|-------------------------------------------------------------------------------------------------------------------------------|
+ | name | 上游所依附的资源 ID,例如 `/apisix/routes/1`, `/apisix/upstreams/1`.
|
+ | ip | 上游节点的 IP 地址。 |
+ | port | 上游节点的端口号。 |
以下是 APISIX 的原始的指标数据集:
@@ -297,6 +304,10 @@
apisix_shared_dict_free_space_bytes{name="balancer-ewma-locks"} 10412032
apisix_shared_dict_free_space_bytes{name="discovery"} 1032192
apisix_shared_dict_free_space_bytes{name="etcd-cluster-health-check"} 10412032
...
+# HELP apisix_upstream_status Upstream status from health check
+# TYPE apisix_upstream_status gauge
+apisix_upstream_status{name="/apisix/routes/1",ip="100.24.156.8",port="80"} 0
+apisix_upstream_status{name="/apisix/routes/1",ip="52.86.68.46",port="80"} 1
```
## 禁用插件
diff --git a/rockspec/apisix-master-0.rockspec
b/rockspec/apisix-master-0.rockspec
index 8a73fd59c..f11c57c3d 100644
--- a/rockspec/apisix-master-0.rockspec
+++ b/rockspec/apisix-master-0.rockspec
@@ -39,7 +39,7 @@ dependencies = {
"lua-resty-balancer = 0.04",
"lua-resty-ngxvar = 0.5.2",
"lua-resty-jit-uuid = 0.0.7",
- "lua-resty-healthcheck-api7 = 2.2.2",
+ "lua-resty-healthcheck-api7 = 2.2.3",
"api7-lua-resty-jwt = 0.2.4",
"lua-resty-hmac-ffi = 0.05",
"lua-resty-cookie = 0.1.0",
diff --git a/t/control/healthcheck.t b/t/control/healthcheck.t
index 3c9cefff8..5d40e9707 100644
--- a/t/control/healthcheck.t
+++ b/t/control/healthcheck.t
@@ -67,6 +67,7 @@ upstreams:
--- config
location /t {
content_by_lua_block {
+ local core = require("apisix.core")
local json = require("toolkit.json")
local t = require("lib.test_admin")
local http = require "resty.http"
@@ -76,21 +77,44 @@ upstreams:
ngx.sleep(2.2)
- local code, body, res = t.test('/v1/healthcheck',
+ local _, _, res = t.test('/v1/healthcheck',
ngx.HTTP_GET)
res = json.decode(res)
+ assert(#res == 1, "invalid number of results")
table.sort(res[1].nodes, function(a, b)
- return a.host < b.host
+ return a.ip < b.ip
end)
- ngx.say(json.encode(res))
+ ngx.say(core.json.stably_encode(res[1].nodes))
- local code, body, res = t.test('/v1/healthcheck/upstreams/1',
+ local _, _, res = t.test('/v1/healthcheck/upstreams/1',
ngx.HTTP_GET)
res = json.decode(res)
table.sort(res.nodes, function(a, b)
- return a.host < b.host
+ return a.ip < b.ip
end)
- ngx.say(json.encode(res))
+ ngx.say(core.json.stably_encode(res.nodes))
+
+ local _, _, res = t.test('/v1/healthcheck/upstreams/1',
+ ngx.HTTP_GET, nil, nil, {["Accept"] = "text/html"})
+ local xml2lua = require("xml2lua")
+ local xmlhandler = require("xmlhandler.tree")
+ local handler = xmlhandler:new()
+ local parser = xml2lua.parser(handler)
+ parser.parse(parser, res)
+ local matches = 0
+ for _, td in ipairs(handler.root.html.body.table.tr) do
+ if td.td then
+ if td.td[4] == "127.0.0.2:1988" then
+ assert(td.td[5] == "unhealthy", "127.0.0.2:1988 is not
unhealthy")
+ matches = matches + 1
+ end
+ if td.td[4] == "127.0.0.1:1980" then
+ assert(td.td[5] == "healthy", "127.0.0.1:1980 is not
healthy")
+ matches = matches + 1
+ end
+ end
+ end
+ assert(matches == 2, "unexpected html")
}
}
--- grep_error_log eval
@@ -99,8 +123,8 @@ qr/unhealthy TCP increment \(.+\) for '[^']+'/
unhealthy TCP increment (1/2) for '(127.0.0.2:1988)'
unhealthy TCP increment (2/2) for '(127.0.0.2:1988)'
--- response_body
-[{"healthy_nodes":[{"host":"127.0.0.1","port":1980,"priority":0,"weight":1}],"name":"upstream#/upstreams/1","nodes":[{"host":"127.0.0.1","port":1980,"priority":0,"weight":1},{"host":"127.0.0.2","port":1988,"priority":0,"weight":1}],"src_id":"1","src_type":"upstreams"}]
-{"healthy_nodes":[{"host":"127.0.0.1","port":1980,"priority":0,"weight":1}],"name":"upstream#/upstreams/1","nodes":[{"host":"127.0.0.1","port":1980,"priority":0,"weight":1},{"host":"127.0.0.2","port":1988,"priority":0,"weight":1}],"src_id":"1","src_type":"upstreams"}
+[{"counter":{"http_failure":0,"success":0,"tcp_failure":0,"timeout_failure":0},"ip":"127.0.0.1","port":1980,"status":"healthy"},{"counter":{"http_failure":0,"success":0,"tcp_failure":2,"timeout_failure":0},"ip":"127.0.0.2","port":1988,"status":"unhealthy"}]
+[{"counter":{"http_failure":0,"success":0,"tcp_failure":0,"timeout_failure":0},"ip":"127.0.0.1","port":1980,"status":"healthy"},{"counter":{"http_failure":0,"success":0,"tcp_failure":2,"timeout_failure":0},"ip":"127.0.0.2","port":1988,"status":"unhealthy"}]
@@ -169,8 +193,8 @@ qr/unhealthy TCP increment \(.+\) for '[^']+'/
unhealthy TCP increment (1/2) for '127.0.0.1(127.0.0.1:1988)'
unhealthy TCP increment (2/2) for '127.0.0.1(127.0.0.1:1988)'
--- response_body
-[{"healthy_nodes":[{"host":"127.0.0.1","port":1980,"priority":0,"weight":1}],"name":"upstream#/routes/1","nodes":[{"host":"127.0.0.1","port":1980,"priority":0,"weight":1},{"host":"127.0.0.1","port":1988,"priority":0,"weight":1}],"src_id":"1","src_type":"routes"}]
-{"healthy_nodes":[{"host":"127.0.0.1","port":1980,"priority":0,"weight":1}],"name":"upstream#/routes/1","nodes":[{"host":"127.0.0.1","port":1980,"priority":0,"weight":1},{"host":"127.0.0.1","port":1988,"priority":0,"weight":1}],"src_id":"1","src_type":"routes"}
+[{"name":"/routes/1","nodes":[{"counter":{"http_failure":0,"success":0,"tcp_failure":0,"timeout_failure":0},"hostname":"127.0.0.1","ip":"127.0.0.1","port":1980,"status":"healthy"},{"counter":{"http_failure":0,"success":0,"tcp_failure":2,"timeout_failure":0},"hostname":"127.0.0.1","ip":"127.0.0.1","port":1988,"status":"unhealthy"}],"type":"http"}]
+{"name":"/routes/1","nodes":[{"counter":{"http_failure":0,"success":0,"tcp_failure":0,"timeout_failure":0},"hostname":"127.0.0.1","ip":"127.0.0.1","port":1980,"status":"healthy"},{"counter":{"http_failure":0,"success":0,"tcp_failure":2,"timeout_failure":0},"hostname":"127.0.0.1","ip":"127.0.0.1","port":1988,"status":"unhealthy"}],"type":"http"}
@@ -244,8 +268,8 @@ qr/unhealthy TCP increment \(.+\) for '[^']+'/
unhealthy TCP increment (1/2) for '127.0.0.1(127.0.0.1:1988)'
unhealthy TCP increment (2/2) for '127.0.0.1(127.0.0.1:1988)'
--- response_body
-[{"healthy_nodes":{},"name":"upstream#/services/1","nodes":[{"host":"127.0.0.1","port":1980,"priority":0,"weight":1},{"host":"127.0.0.1","port":1988,"priority":0,"weight":1}],"src_id":"1","src_type":"services"}]
-{"healthy_nodes":{},"name":"upstream#/services/1","nodes":[{"host":"127.0.0.1","port":1980,"priority":0,"weight":1},{"host":"127.0.0.1","port":1988,"priority":0,"weight":1}],"src_id":"1","src_type":"services"}
+[{"name":"/services/1","nodes":[{"counter":{"http_failure":0,"success":0,"tcp_failure":2,"timeout_failure":0},"hostname":"127.0.0.1","ip":"127.0.0.1","port":1988,"status":"unhealthy"}],"type":"http"}]
+{"name":"/services/1","nodes":[{"counter":{"http_failure":0,"success":0,"tcp_failure":2,"timeout_failure":0},"hostname":"127.0.0.1","ip":"127.0.0.1","port":1988,"status":"unhealthy"}],"type":"http"}
@@ -279,69 +303,3 @@ GET /v1/healthcheck/route/1
--- error_code: 400
--- response_body
{"error_msg":"invalid src type route"}
-
-
-
-=== TEST 7: default health status
---- yaml_config
-apisix:
- node_listen: 1984
-deployment:
- role: data_plane
- role_data_plane:
- config_provider: yaml
---- apisix_yaml
-routes:
- -
- uris:
- - /hello
- upstream_id: 1
-upstreams:
- - nodes:
- "127.0.0.1:1988": 1
- "127.0.0.2:1980": 1
- type: chash
- id: 1
- key: "uri"
- checks:
- active:
- http_path: "/status"
- healthy:
- interval: 1
- successes: 1
- unhealthy:
- interval: 1
- http_failures: 1
-#END
---- config
- location /t {
- content_by_lua_block {
- local json = require("toolkit.json")
- local t = require("lib.test_admin")
-
- -- not hit
- local code, body, res = t.test('/v1/healthcheck',
- ngx.HTTP_GET)
- ngx.print(res)
-
- -- hit, but no enough to mark node to unhealthy
- local http = require "resty.http"
- local uri = "http://127.0.0.1:"; .. ngx.var.server_port .. "/hello"
- local httpc = http.new()
- local res, err = httpc:request_uri(uri, {method = "GET"})
- local code, body, res = t.test('/v1/healthcheck',
- ngx.HTTP_GET)
- res = json.decode(res)
- table.sort(res[1].healthy_nodes, function(a, b)
- return a.host < b.host
- end)
- ngx.say(json.encode(res[1].healthy_nodes))
- }
- }
---- grep_error_log eval
-qr/unhealthy TCP increment \(.+\) for '[^']+'/
---- grep_error_log_out
-unhealthy TCP increment (1/2) for '(127.0.0.1:1988)'
---- response_body
-{}
-[{"host":"127.0.0.1","port":1988,"priority":0,"weight":1},{"host":"127.0.0.2","port":1980,"priority":0,"weight":1}]
diff --git a/t/discovery/consul.t b/t/discovery/consul.t
index 39c5ab287..cf97e0ce8 100644
--- a/t/discovery/consul.t
+++ b/t/discovery/consul.t
@@ -558,6 +558,9 @@ upstreams:
table.sort(nodes, function(a, b)
return a.port < b.port
end)
+ for _, node in ipairs(nodes) do
+ node.counter = nil
+ end
ngx.say(json.encode(nodes))
local code, body, res = t.test('/v1/healthcheck/upstreams/1',
@@ -567,12 +570,15 @@ upstreams:
table.sort(nodes, function(a, b)
return a.port < b.port
end)
+ for _, node in ipairs(nodes) do
+ node.counter = nil
+ end
ngx.say(json.encode(nodes))
}
}
--- request
GET /thc
--- response_body
-[{"host":"127.0.0.1","port":30513,"priority":0,"weight":1},{"host":"127.0.0.1","port":30514,"priority":0,"weight":1}]
-[{"host":"127.0.0.1","port":30513,"priority":0,"weight":1},{"host":"127.0.0.1","port":30514,"priority":0,"weight":1}]
+[{"ip":"127.0.0.1","port":30513,"status":"healthy"},{"ip":"127.0.0.1","port":30514,"status":"healthy"}]
+[{"ip":"127.0.0.1","port":30513,"status":"healthy"},{"ip":"127.0.0.1","port":30514,"status":"healthy"}]
--- ignore_error_log
diff --git a/t/discovery/consul_kv.t b/t/discovery/consul_kv.t
index da557d1d0..9363f768d 100644
--- a/t/discovery/consul_kv.t
+++ b/t/discovery/consul_kv.t
@@ -425,25 +425,33 @@ upstreams:
local code, body, res = t.test('/v1/healthcheck',
ngx.HTTP_GET)
res = json.decode(res)
- table.sort(res[1].nodes, function(a, b)
- return a.host < b.host
+ local nodes = res[1].nodes
+ table.sort(nodes, function(a, b)
+ return a.ip < b.ip
end)
- ngx.say(json.encode(res))
+ for _, node in ipairs(nodes) do
+ node.counter = nil
+ end
+ ngx.say(json.encode(nodes))
local code, body, res = t.test('/v1/healthcheck/upstreams/1',
ngx.HTTP_GET)
res = json.decode(res)
- table.sort(res.nodes, function(a, b)
- return a.host < b.host
+ local nodes = res.nodes
+ table.sort(nodes, function(a, b)
+ return a.ip < b.ip
end)
- ngx.say(json.encode(res))
+ for _, node in ipairs(nodes) do
+ node.counter = nil
+ end
+ ngx.say(json.encode(nodes))
}
}
--- request
GET /thc
--- response_body
-[{"healthy_nodes":[{"host":"127.0.0.1","port":30511,"priority":0,"weight":1}],"name":"upstream#/upstreams/1","nodes":[{"host":"127.0.0.1","port":30511,"priority":0,"weight":1},{"host":"127.0.0.2","port":1988,"priority":0,"weight":1}],"src_id":"1","src_type":"upstreams"}]
-{"healthy_nodes":[{"host":"127.0.0.1","port":30511,"priority":0,"weight":1}],"name":"upstream#/upstreams/1","nodes":[{"host":"127.0.0.1","port":30511,"priority":0,"weight":1},{"host":"127.0.0.2","port":1988,"priority":0,"weight":1}],"src_id":"1","src_type":"upstreams"}
+[{"ip":"127.0.0.1","port":30511,"status":"healthy"},{"ip":"127.0.0.2","port":1988,"status":"unhealthy"}]
+[{"ip":"127.0.0.1","port":30511,"status":"healthy"},{"ip":"127.0.0.2","port":1988,"status":"unhealthy"}]
--- ignore_error_log