This is an automated email from the ASF dual-hosted git repository.

monkeydluffy pushed a commit to branch master
in repository https://gitbox.apache.org/repos/asf/apisix.git
The following commit(s) were added to refs/heads/master by this push:
new e910d8c61 docs: Add tutorial on monitoring API health check (#9897)
e910d8c61 is described below
commit e910d8c617864513a7b48b64edc3de0782f55290
Author: Bobur Umurzokov <[email protected]>
AuthorDate: Wed Jul 26 11:47:51 2023 +0300
docs: Add tutorial on monitoring API health check (#9897)
---
docs/en/latest/config.json | 11 +-
.../latest/tutorials/monitor-api-health-check.md | 192 +++++++++++++++++++++
2 files changed, 201 insertions(+), 2 deletions(-)
diff --git a/docs/en/latest/config.json b/docs/en/latest/config.json
index 96fc3c57d..64e717c1b 100644
--- a/docs/en/latest/config.json
+++ b/docs/en/latest/config.json
@@ -26,11 +26,18 @@
"items": [
"tutorials/expose-api",
"tutorials/protect-api",
- "tutorials/observe-your-api",
+ {
+ "type": "category",
+ "label": "Observability",
+ "items": [
+ "tutorials/observe-your-api",
+ "tutorials/health-check",
+ "tutorials/monitor-api-health-check"
+ ]
+ },
"tutorials/manage-api-consumers",
"tutorials/cache-api-responses",
"tutorials/add-multiple-api-versions",
- "tutorials/health-check",
"tutorials/client-to-apisix-mtls",
"tutorials/websocket-authentication"
]
diff --git a/docs/en/latest/tutorials/monitor-api-health-check.md
b/docs/en/latest/tutorials/monitor-api-health-check.md
new file mode 100644
index 000000000..e90142b89
--- /dev/null
+++ b/docs/en/latest/tutorials/monitor-api-health-check.md
@@ -0,0 +1,192 @@
+---
+title: Monitor API Health Check with Prometheus
+keywords:
+ - API Health Check
+ - Monitoring with Prometheus
+ - API Gateway
+description: In this tutorial, we'll guide you on how to enable and monitor
API health checks using APISIX and Prometheus.
+---
+
+<!--
+#
+# Licensed to the Apache Software Foundation (ASF) under one or more
+# contributor license agreements. See the NOTICE file distributed with
+# this work for additional information regarding copyright ownership.
+# The ASF licenses this file to You under the Apache License, Version 2.0
+# (the "License"); you may not use this file except in compliance with
+# the License. You may obtain a copy of the License at
+#
+# http://www.apache.org/licenses/LICENSE-2.0
+#
+# Unless required by applicable law or agreed to in writing, software
+# distributed under the License is distributed on an "AS IS" BASIS,
+# WITHOUT WARRANTIES OR CONDITIONS OF ANY KIND, either express or implied.
+# See the License for the specific language governing permissions and
+# limitations under the License.
+#
+-->
+
+[APISIX](https://apisix.apache.org/) has a [health
check](https://apisix.apache.org/docs/apisix/tutorials/health-check/)
mechanism, which proactively checks the health status of the upstream nodes in
your system. Also, APISIX integrates with [Prometheus](https://prometheus.io/)
through its [plugin](https://apisix.apache.org/docs/apisix/plugins/prometheus/)
that exposes upstream nodes (multiple instances of a backend API service that
APISIX manages) health check metrics on the Prometheus [...]
+
+In this tutorial, we'll guide you on how to **enable and monitor API health
checks** using APISIX and Prometheus.
+
+## Prerequisite(s)
+
+- Before you start, it is good to have a basic understanding of APISIX.
Familiarity with [API
gateway](https://apisix.apache.org/docs/apisix/terminology/api-gateway/), and
its key concepts such as
[routes](https://docs.api7.ai/apisix/key-concepts/routes),
[upstream](https://docs.api7.ai/apisix/key-concepts/upstreams), [Admin
API](https://apisix.apache.org/docs/apisix/admin-api/),
[plugins](https://docs.api7.ai/apisix/key-concepts/plugins), and HTTP protocol
will also be beneficial.
+- [Docker](https://docs.docker.com/get-docker/) is used to install the
containerized etcd and APISIX.
+- Install [cURL](https://curl.se/) to send requests to the services for
validation.
+
+## Start the APISIX demo project
+
+This project leverages the pre-defined [Docker Compose
configuration](https://github.com/apache/apisix-docker/blob/master/example/docker-compose.yml)
file to set up, deploy and run APISIX, etcd, Prometheus, and other services
with a single command. First, clone the
[apisix-docker](https://github.com/apache/apisix-docker) repo on GitHub and
open it in your favorite editor, navigate to `/example` folder, and start the
project by simply running `docker compose up` from the folder.
+
+When you start the project, Docker downloads any images it needs to run. You
can see the full list of services in
[docker-compose.yaml](https://github.com/apache/apisix-docker/blob/master/example/docker-compose.yml)
file.
+
+## Add health check API endpoints in upstream
+
+To check API health periodically, APISIX needs an HTTP path of the health
endpoint of the upstream service. So, you need first to add `/health` endpoint
for your backend service. From there, you inspect the most relevant metrics
for that service such as memory usage, database connectivity, response
duration, and more. Assume that we have two backend REST API services web1 and
web2 running using the demo project and each has its **own health check**
endpoint at URL path `/health`. At th [...]
+
+> The simplest and standardized way to validate the status of a service is to
define a new [health
check](https://datatracker.ietf.org/doc/html/draft-inadarei-api-health-check)
endpoint like `/health` or `/status`
+
+## Setting Up Health Checks in APISIX
+
+This process involves checking the operational status of the 'upstream' nodes.
APISIX provides two types of health checks: **Active checks** and **Passive
Checks** respectively. Read more about Health Checks and how to enable them
[here](https://apisix.apache.org/docs/apisix/tutorials/health-check/). Use the
[Admin API](https://apisix.apache.org/docs/apisix/admin-api/) to create an
Upstream object. Here is an example of creating an
[Upstream](https://apisix.apache.org/docs/apisix/termino [...]
+
+```bash
+curl "http://127.0.0.1:9180/apisix/admin/upstreams/1"; -H "X-API-KEY:
edd1c9f034335f136f87ad84b625c8f1" -X PUT -d '
+{
+ "nodes":{
+ "web1:80":1,
+ "web2:80":1
+ },
+ "checks":{
+ "active":{
+ "timeout":5,
+ "type":"http",
+ "http_path":"/health",
+ "healthy":{
+ "interval":2,
+ "successes":1
+ },
+ "unhealthy":{
+ "interval":1,
+ "http_failures":2
+ }
+ }
+ }
+}'
+```
+
+This example configures an active health check on the **`/health`** endpoint
of the node. It considers the node healthy after **one successful health
check** and unhealthy **after two failed health checks**.
+
+> Note that sometimes you might need the IP addresses of upstream nodes, not
their domains (`web1` and `web2`) if you are running services outside docker
network. Health check will be started only if the number of nodes (resolved
IPs) is bigger than 1.
+
+## Enable the Prometheus Plugin
+
+Create a global rule to enable the `prometheus` plugin on all routes by adding
`"prometheus": {}` in the plugins option. APISIX gathers internal runtime
metrics and exposes them through port `9091` and URI path
`/apisix/prometheus/metrics` by default that Prometheus can scrape. It is also
possible to customize the export port and **URI path**, **add** **extra labels,
the frequency of these scrapes, and other parameters** by configuring them in
the Prometheus configuration `/prometheus_co [...]
+
+```bash
+curl "http://127.0.0.1:9180/apisix/admin/global_rules"; -H "X-API-KEY:
edd1c9f034335f136f87ad84b625c8f1" -X PUT -d '
+{
+ "id":"rule-for-metrics",
+ "plugins":{
+ "prometheus":{
+ }
+ }
+}'
+```
+
+## Create a Route
+
+Create a [Route](https://apisix.apache.org/docs/apisix/terminology/route/)
object to route incoming requests to upstream nodes:
+
+```bash
+curl "http://127.0.0.1:9180/apisix/admin/routes/1"; -H "X-API-KEY:
edd1c9f034335f136f87ad84b625c8f1" -X PUT -d '
+{
+ "name":"backend-service-route",
+ "methods":[
+ "GET"
+ ],
+ "uri":"/",
+ "upstream_id":"1"
+}'
+```
+
+## Send validation requests to the route
+
+To generate some metrics, you try to send few requests to the route we created
in the previous step:
+
+```bash
+curl -i -X GET "http://localhost:9080/";
+```
+
+If you run the above requests a couple of times, you can see from responses
that APISX routes some requests to `node1` and others to `node2`. That’s how
Gateway load balancing works!
+
+```bash
+HTTP/1.1 200 OK
+Content-Type: text/plain; charset=utf-8
+Content-Length: 10
+Connection: keep-alive
+Date: Sat, 22 Jul 2023 10:16:38 GMT
+Server: APISIX/3.3.0
+
+hello web2
+
+...
+
+HTTP/1.1 200 OK
+Content-Type: text/plain; charset=utf-8
+Content-Length: 10
+Connection: keep-alive
+Date: Sat, 22 Jul 2023 10:16:39 GMT
+Server: APISIX/3.3.0
+
+hello web1
+```
+
+## Collecting health check data with the Prometheus plugin
+
+Once the health checks and route are configured in APISIX, you can employ
Prometheus to monitor health checks. APISIX **automatically exposes health
check metrics data** for your APIs if the health check parameter is enabled for
upstream nodes. You will see metrics in the response after fetching them from
APISIX:
+
+```bash
+curl -i http://127.0.0.1:9091/apisix/prometheus/metrics
+```
+
+Example Output:
+
+```bash
+# HELP apisix_http_requests_total The total number of client requests since
APISIX started
+# TYPE apisix_http_requests_total gauge
+apisix_http_requests_total 119740
+# HELP apisix_http_status HTTP status codes per service in APISIX
+# TYPE apisix_http_status counter
+apisix_http_status{code="200",route="1",matched_uri="/",matched_host="",service="",consumer="",node="172.27.0.5"}
29
+apisix_http_status{code="200",route="1",matched_uri="/",matched_host="",service="",consumer="",node="172.27.0.7"}
12
+# HELP apisix_upstream_status Upstream status from health check
+# TYPE apisix_upstream_status gauge
+apisix_upstream_status{name="/apisix/upstreams/1",ip="172.27.0.5",port="443"} 0
+apisix_upstream_status{name="/apisix/upstreams/1",ip="172.27.0.5",port="80"} 1
+apisix_upstream_status{name="/apisix/upstreams/1",ip="172.27.0.7",port="443"} 0
+apisix_upstream_status{name="/apisix/upstreams/1",ip="172.27.0.7",port="80"} 1
+```
+
+Health check data is represented with metrics label `apisix_upstream_status`.
It has attributes like upstream `name`, `ip` and `port`. A value of 1
represents healthy and 0 means the upstream node is unhealthy.
+
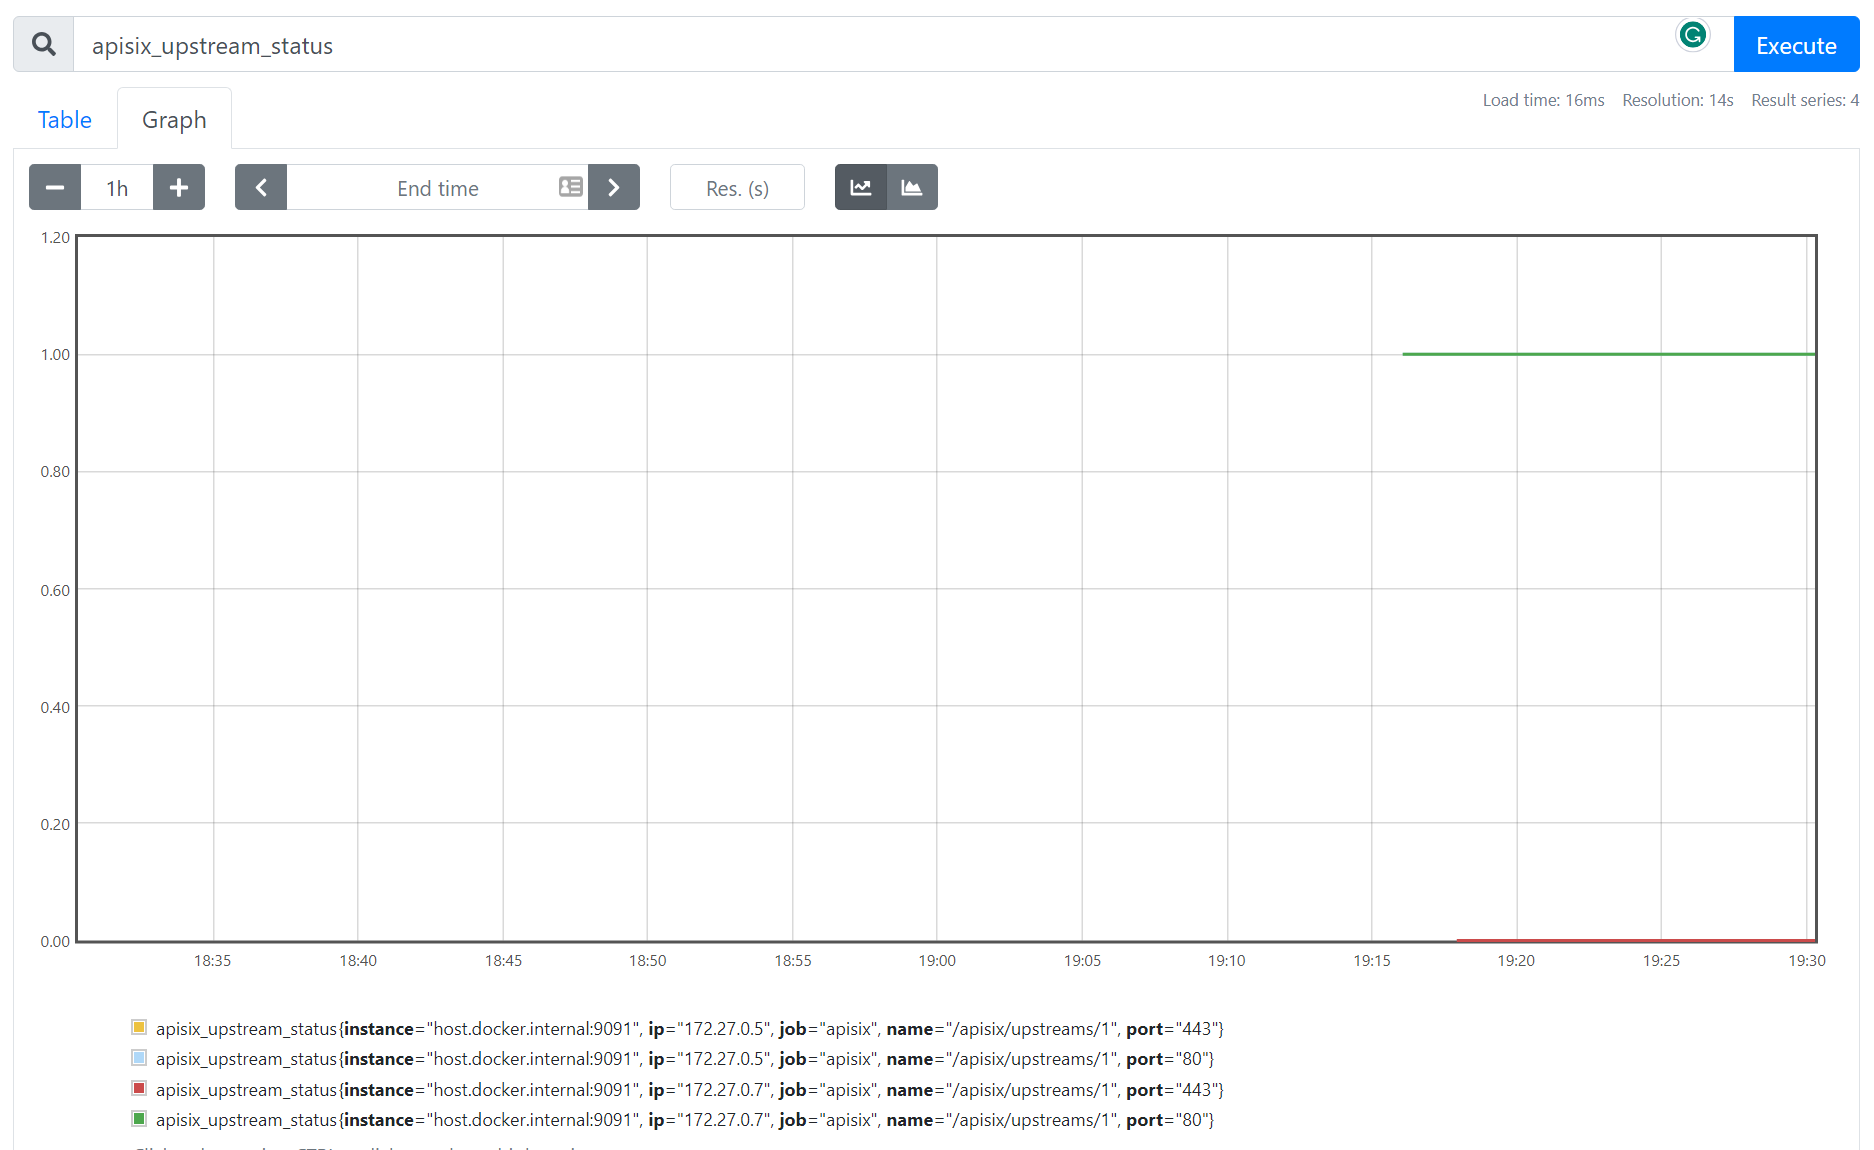
+## Visualize the data in the Prometheus dashboard
+
+Navigate to http://localhost:9090/ where the Prometheus instance is running in
Docker and type **Expression** `apisix_upstream_status` in the search bar. You
can also see the output of the health check statuses of upstream nodes on the
**Prometheus dashboard** in the table or graph view:
+
+
+
+## Next Steps
+
+You have now learned how to set up and monitor API health checks with
Prometheus and APISIX. APISIX Prometheus plugin is configured to connect
[Grafana](https://grafana.com/) automatically to visualize metrics. Keep
exploring the data and customize the [Grafana
dashboard](https://grafana.com/grafana/dashboards/11719-apache-apisix/) by
adding a panel that shows the number of active health checks.
+
+### Related resources
+
+- [Monitoring API Metrics: How to Ensure Optimal Performance of Your
API?](https://api7.ai/blog/api7-portal-monitor-api-metrics)
+- [Monitoring Microservices with Prometheus and
Grafana](https://api7.ai/blog/introduction-to-monitoring-microservices)
+
+### Recommended content
+
+- [Implementing resilient applications with API Gateway (Health
Check)](https://dev.to/apisix/implementing-resilient-applications-with-api-gateway-health-check-338c)