This is an automated email from the ASF dual-hosted git repository.

guoqi pushed a commit to branch master
in repository https://gitbox.apache.org/repos/asf/apisix-website.git
The following commit(s) were added to refs/heads/master by this push:
new 595bba44924 docs: add unlock-observability-for-apisix-with-deepflow.md
(#1769)
595bba44924 is described below
commit 595bba449246a5760f288b499ee1ca5af2605111
Author: Yilia Lin <[email protected]>
AuthorDate: Wed Feb 7 12:03:36 2024 +0800
docs: add unlock-observability-for-apisix-with-deepflow.md (#1769)
---
...nlock-observability-for-apisix-with-deepflow.md | 327 +++++++++++++++++++++
...nlock-observability-for-apisix-with-deepflow.md | 326 ++++++++++++++++++++
2 files changed, 653 insertions(+)
diff --git
a/blog/en/blog/2024/02/07/unlock-observability-for-apisix-with-deepflow.md
b/blog/en/blog/2024/02/07/unlock-observability-for-apisix-with-deepflow.md
new file mode 100644
index 00000000000..4cfe929fef0
--- /dev/null
+++ b/blog/en/blog/2024/02/07/unlock-observability-for-apisix-with-deepflow.md
@@ -0,0 +1,327 @@
+---
+title: "Unlock All-in-One Observability for APISIX with DeepFlow"
+authors:
+ - name: Qian Li
+ title: Author
+ - name: Bin Peng
+ title: Author
+keywords:
+ - APISIX
+ - DeepFlow
+ - Observability
+description: This article aims to elucidate how to leverage DeepFlow's
zero-code feature based on eBPF to construct an observability solution for
APISIX.
+tags: [Ecosystem]
+image:
https://static.apiseven.com/uploads/2024/02/07/nQJ5SWsx_deepflow-cover-en.jpeg
+---
+
+> This article aims to elucidate how to leverage DeepFlow's zero-code feature
based on eBPF to construct an observability solution for APISIX.
+<!--truncate-->
+
+With the growing emphasis on the observability of application components,
Apache APISIX has introduced a plugin mechanism to enrich observability
signals. However, these data are scattered across multiple stacks, creating
data silos. **This article aims to elucidate how to leverage DeepFlow's
zero-code feature based on eBPF to construct an observability solution for
APISIX.** On this basis, it integrates the rich data sources of existing APISIX
plugins to eliminate data silos and build a [...]
+
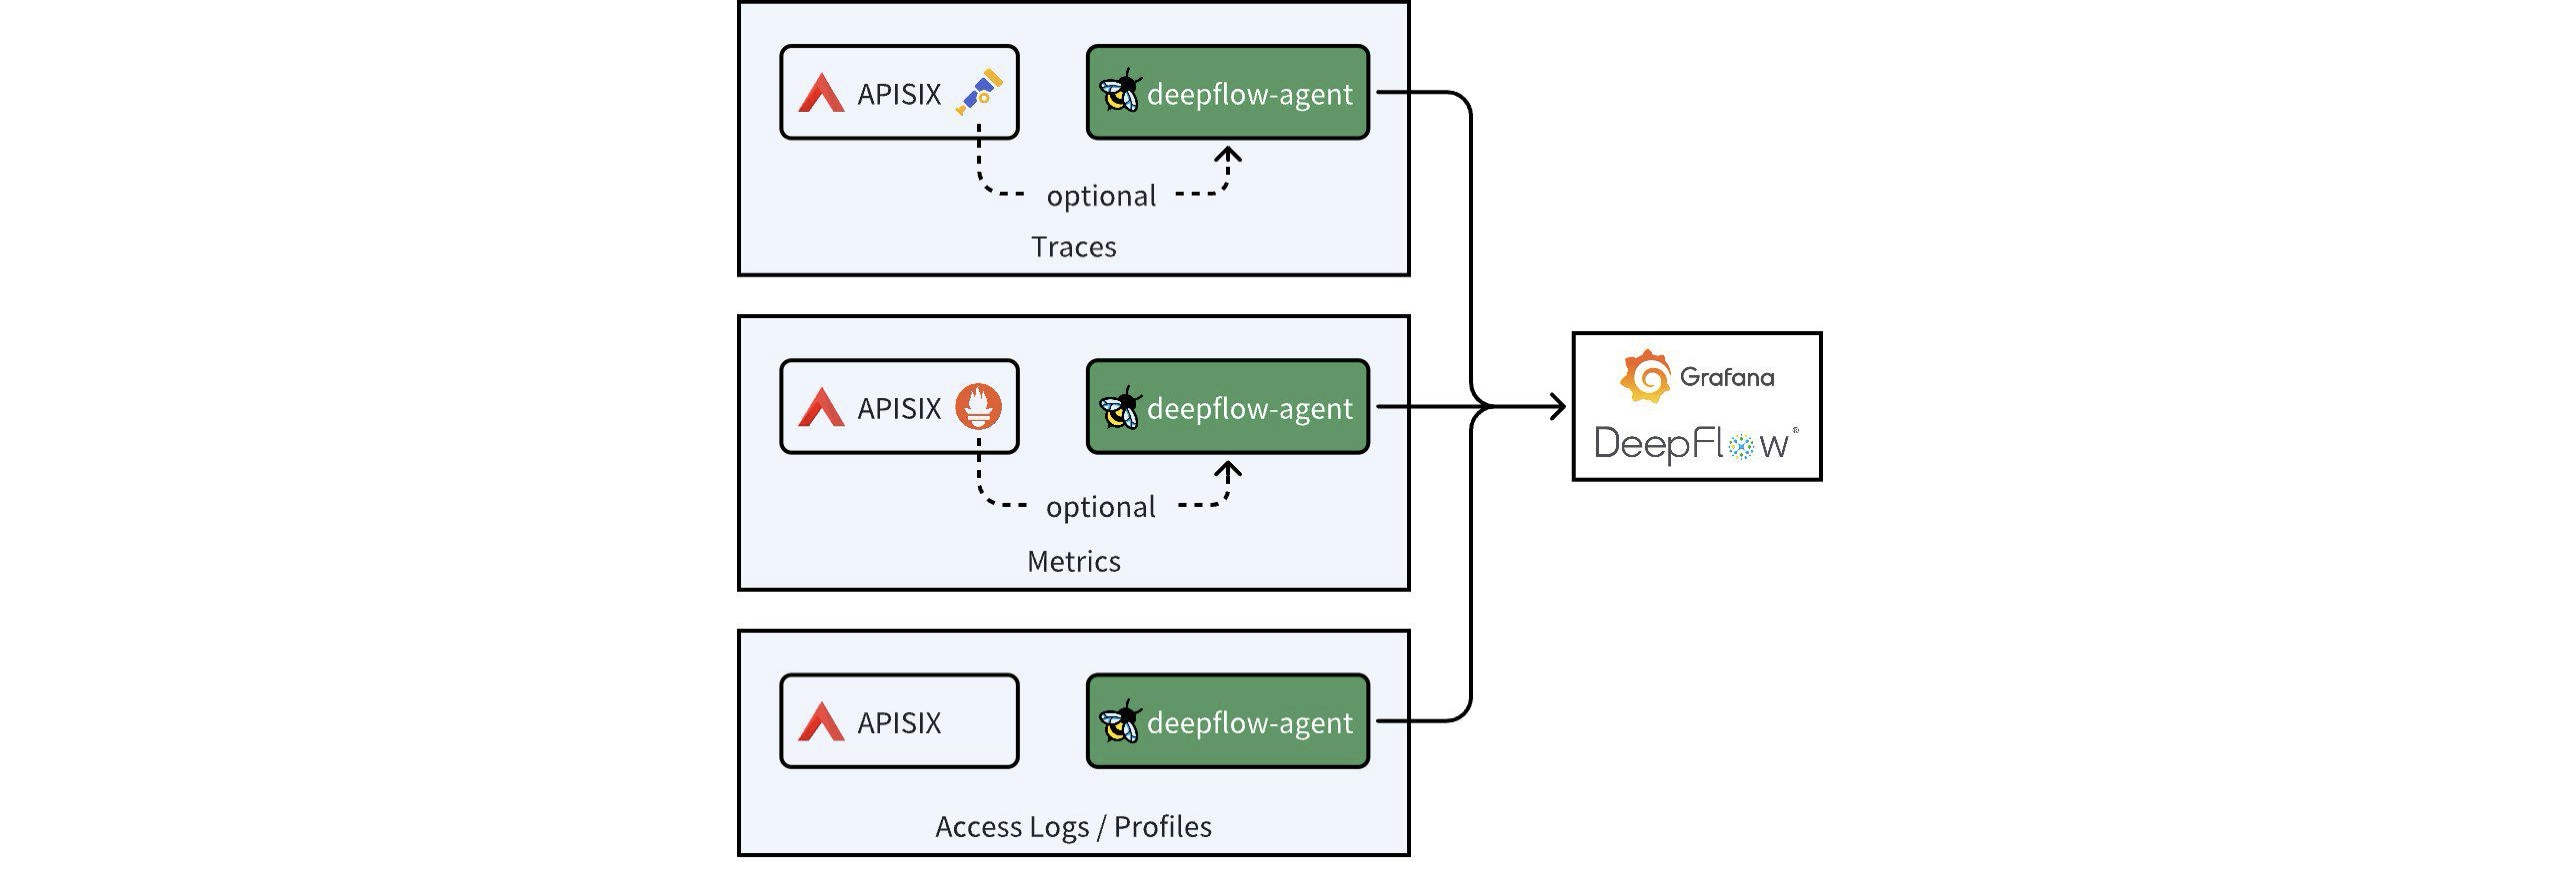
+Through DeepFlow, APISIX can achieve comprehensive observability from traffic
monitoring and tracing analysis to performance optimization, eliminating data
dispersion and providing a centralized view. This accelerates fault diagnosis
and performance tuning, making the work of DevOps and SRE teams more efficient.
**This article will focus on how APISIX's tracing data, metric data, access
logs, and performance profiling data can be integrated with DeepFlow.**
+
+
+
+## 1. Install APISIX and DeepFlow
+
+For convenience, this article describes deploying both DeepFlow and APISIX as
Kubernetes services, with the entire deployment process taking approximately 5
minutes. For detailed deployment steps, refer to the
[DeepFlow](https://deepflow.io/docs/ce-install/all-in-one/) and
[APISIX](https://apisix.apache.org/docs/apisix/3.2/installation-guide/)
official deployment documentation.
+
+Note: To leverage DeepFlow's observability capabilities that utilize eBPF
technology, your host's **Linux kernel must be version 4.14 or higher**.
+
+## 2. Distributed Tracing
+
+There are two approaches to implementing distributed tracing for APISIX and
backend services using DeepFlow: Firstly, DeepFlow leverages eBPF to enable
out-of-the-box, RPC-level distributed tracing for APISIX and backend services,
requiring no code changes. Secondly, if backend services have APM (Application
Performance Monitoring) tools like OpenTelemetry or SkyWalking enabled, you can
integrate all tracing data into DeepFlow using the APISIX Tracers plugin. This
enables comprehensive, [...]
+
+
+
+### 2.1 DeepFlow eBPF AutoTracing
+
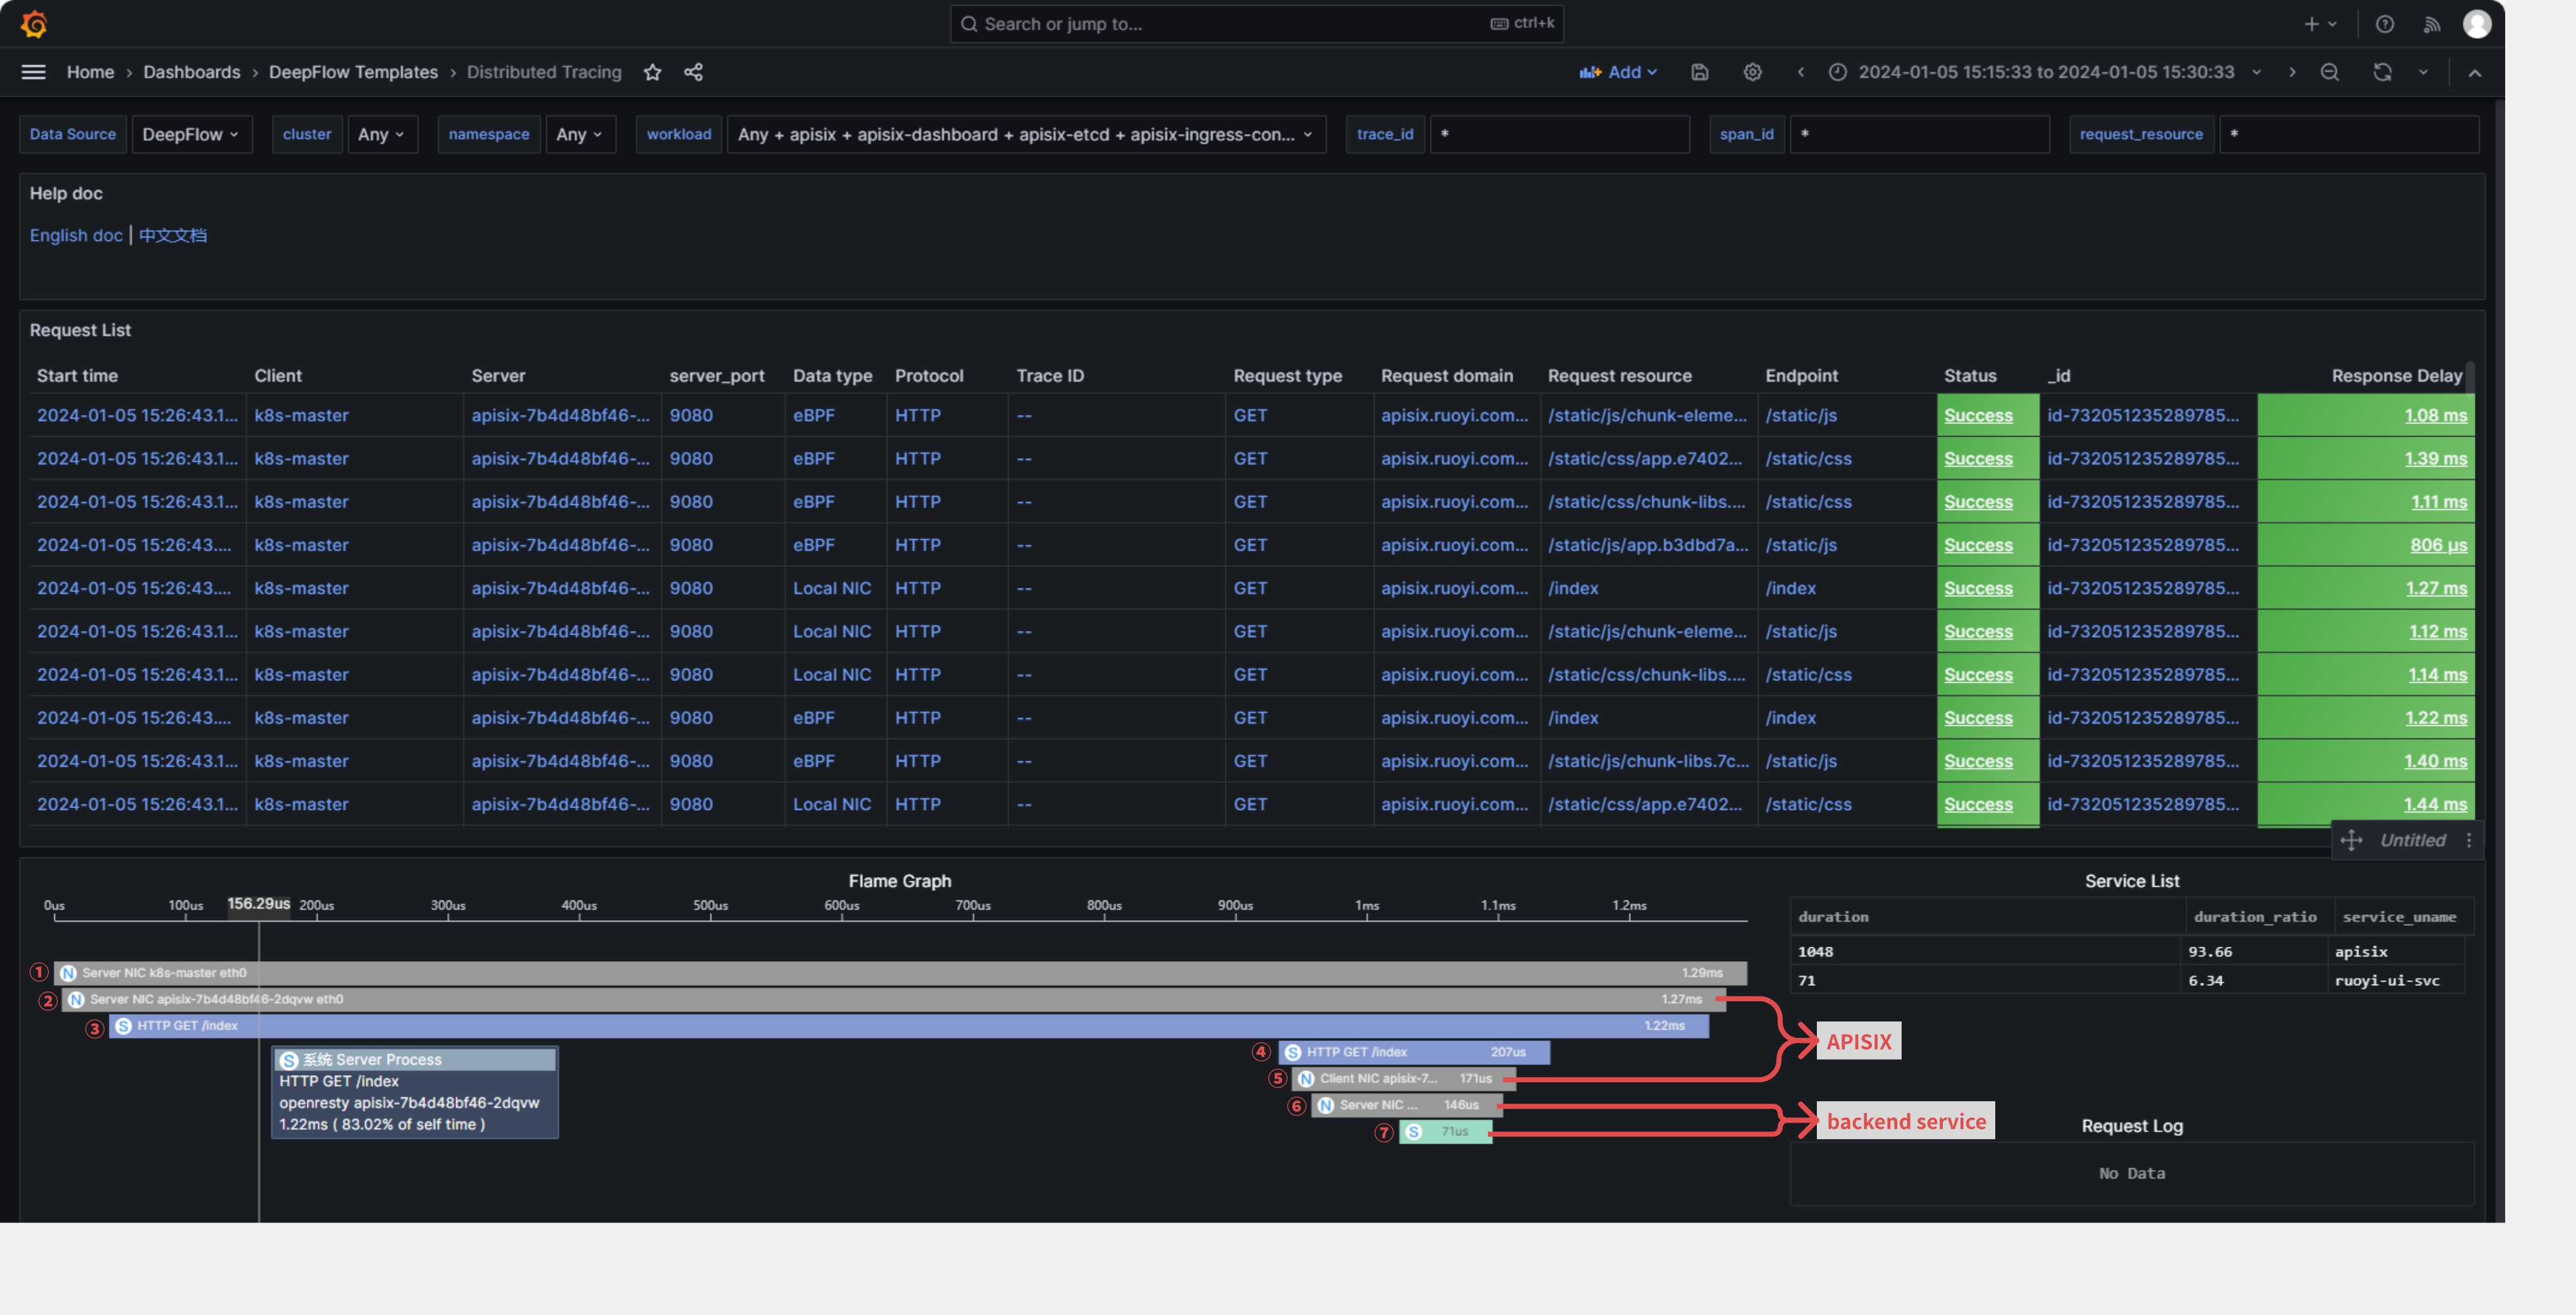
+**DeepFlow offers out-of-the-box distributed tracing (AutoTracing) that
requires no APISIX plugins or code changes to be enabled.** It only
necessitates deploying the deepflow-agent on the server where APISIX is
located. In Grafana, find the [Distributed Tracing Dashboard provided by
DeepFlow](https://ce-demo.deepflow.yunshan.net/d/Distributed_Tracing/distributed-tracing?orgId=1),
where you can initiate a trace on a specific request and see the end-to-end
trace of that request in both AP [...]
+
+- (1): Accesses the APISIX gateway service on the K8s Node NIC via nodeport.
+- (2): Enters the NIC of the POD corresponding to the APISIX gateway service.
+- (3): Goes into the OpenResty process within the APISIX gateway service.
+- (4): The request is forwarded to the backend service by the OpenResty
process.
+- (5): Forwarded by the NIC of the POD corresponding to the APISIX gateway
service.
+- (6)/(7): Forwarded to the backend service.
+
+
+
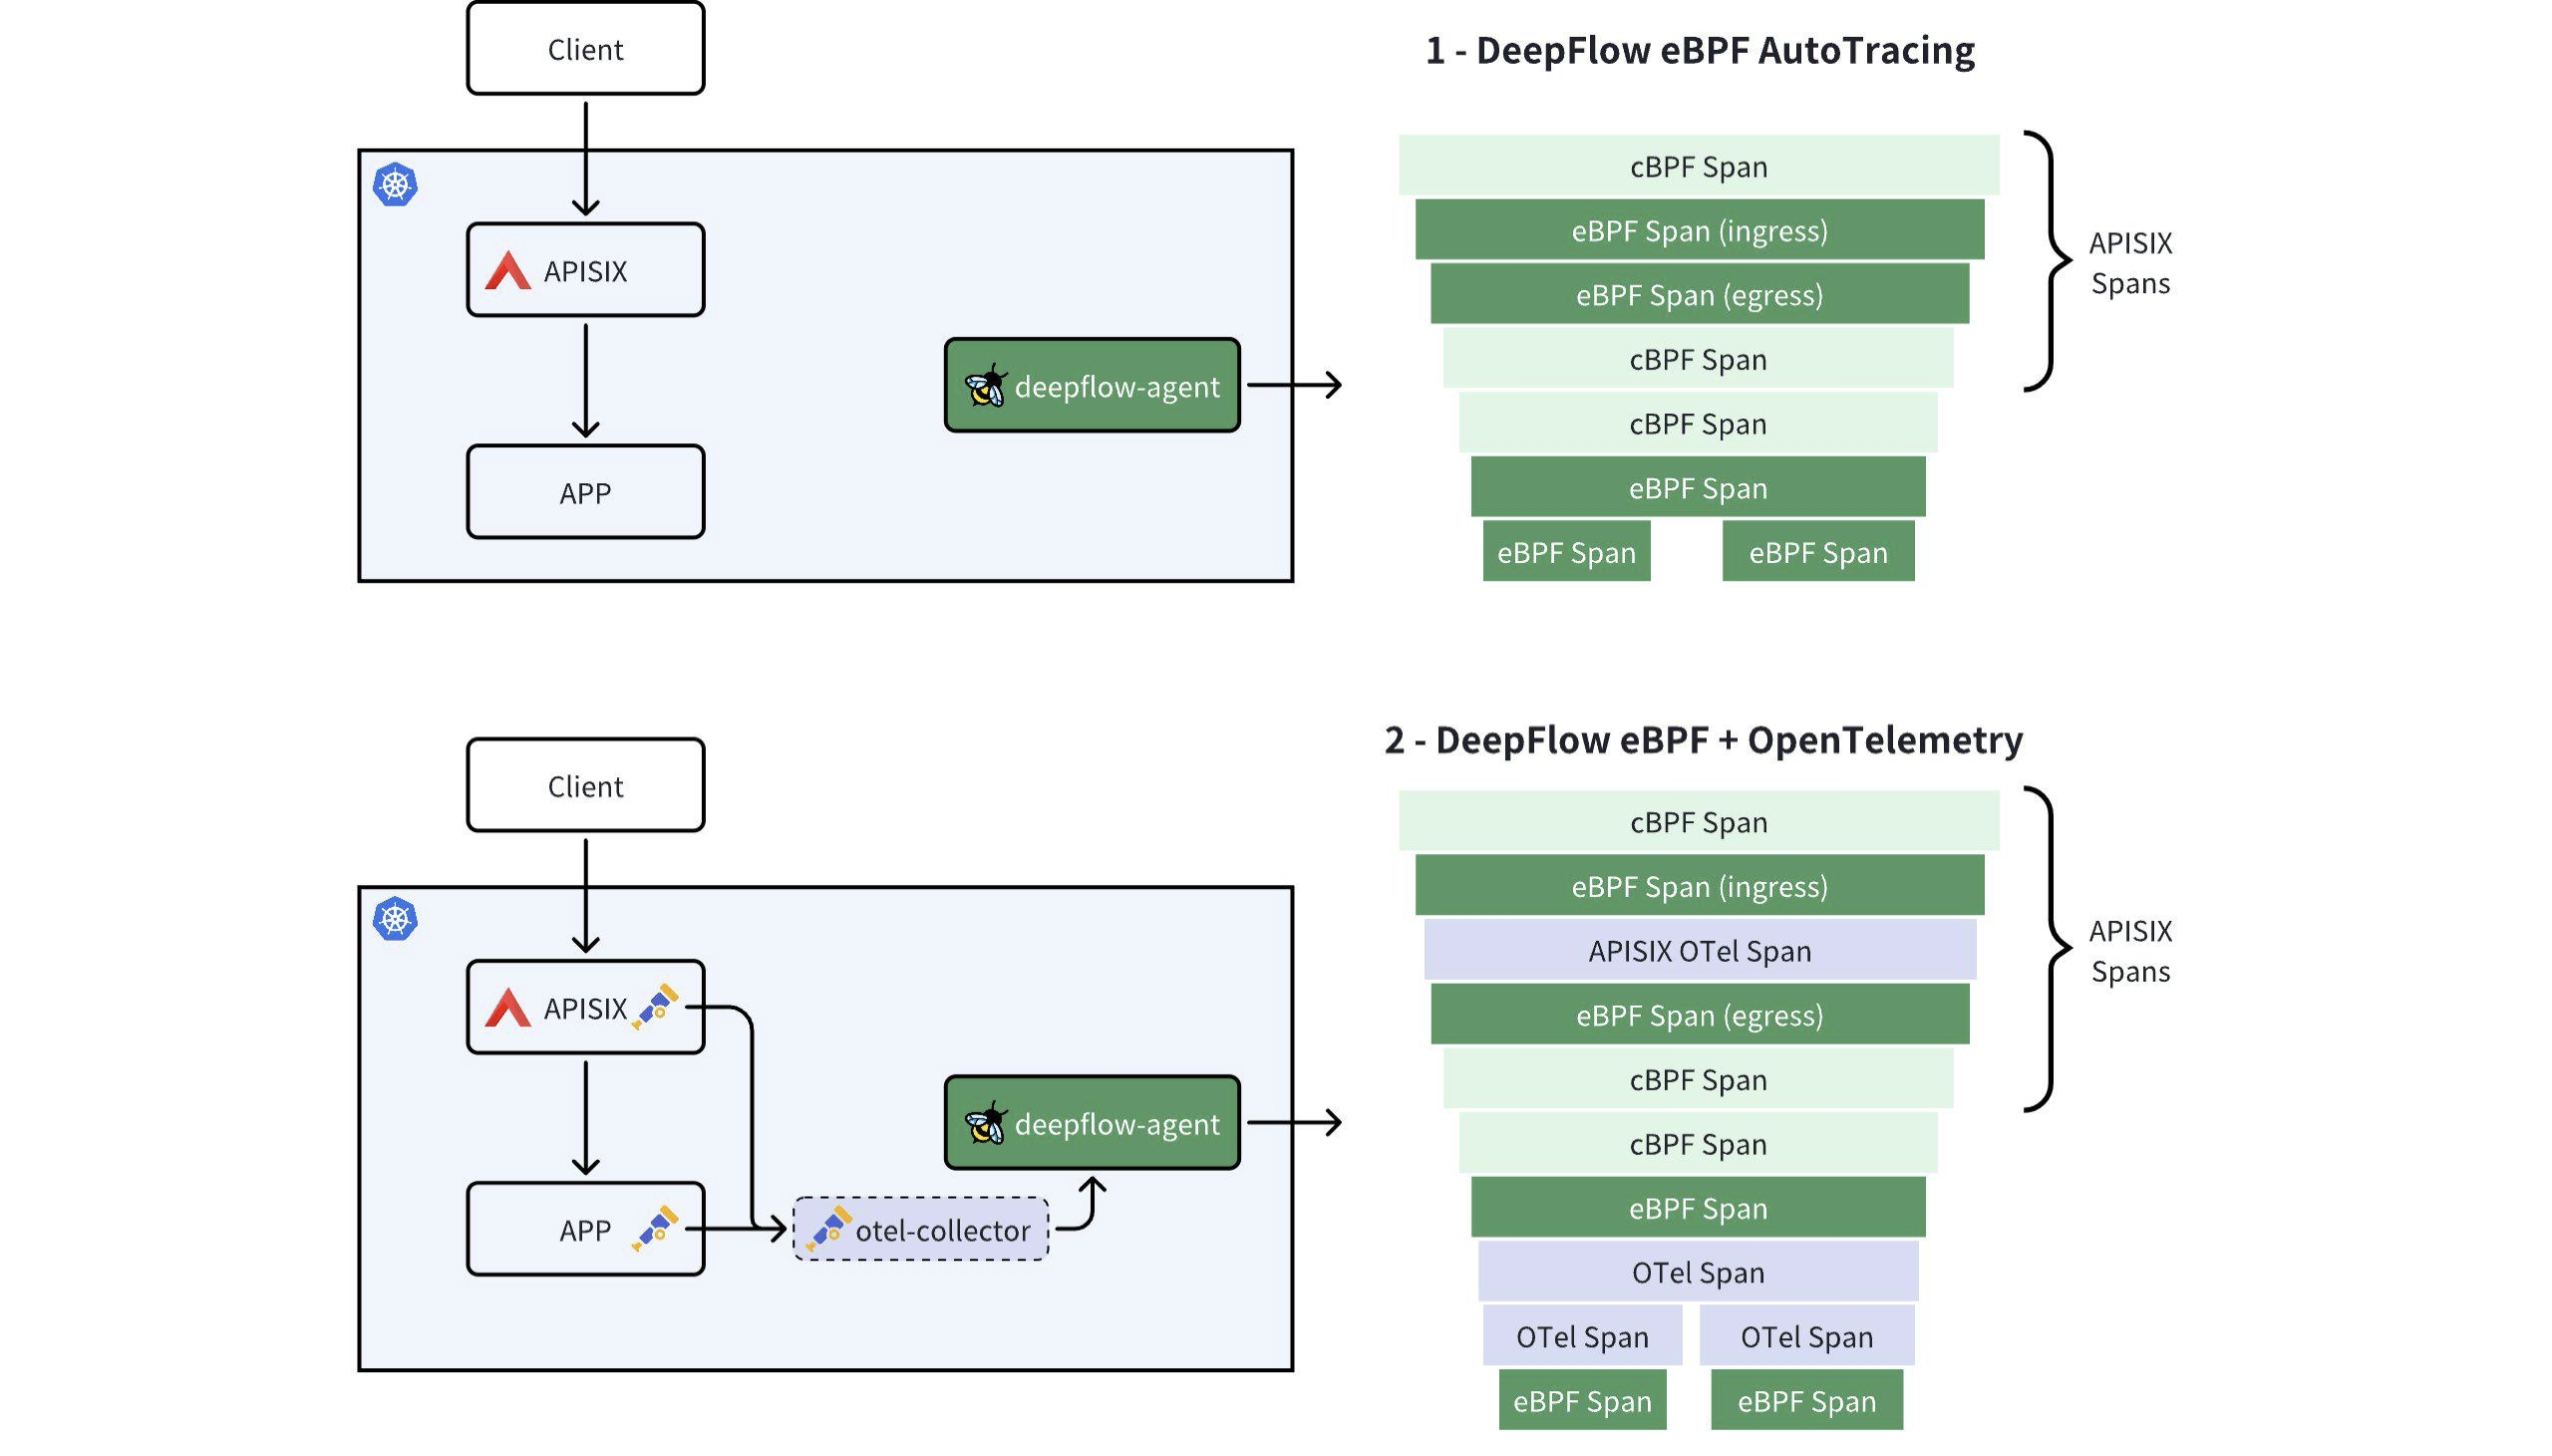
+### 2.2 DeepFlow eBPF + OpenTelemetry
+
+This approach involves APISIX generating trace data using the OpenTelemetry
plugin, while the backend service also has APM capabilities and can convert
generated trace data into the OpenTelemetry format. When APISIX and backend
services both send trace data to DeepFlow, it can create a comprehensive
trace-tree without any blind spots, incorporating APM application SPAN, eBPF
system SPAN, and cBPF network SPAN.
+
+This method is ideal for achieving function-level distributed tracing inside
the application process or when the backend service uses a thread pool for call
handling, which may disrupt DeepFlow AutoTracing.
+
+#### 2.2.1 Deploy Backend Services with APM Enabled
+
+To demonstrate the full tracing effect, we first deploy a demo application
behind the APISIX gateway that supports OpenTelemetry. The deployment of the
Demo application can refer to: "[DeepFlow Demo - One-click deployment of a
WebShop application composed of five microservices written in Spring
Boot](https://deepflow.io/docs/integration/input/tracing/opentelemetry/#experience-based-on-the-spring-boot-demo)".
Create a route on APISIX to access the backend service, with the access domain
b [...]
+
+```
+apiVersion: apisix.apache.org/v2
+kind: ApisixRoute
+metadata:
+ name: deepflow-apisix-demo
+ namespace: deepflow-otel-spring-demo
+spec:
+ http:
+ - name: deepflow-apisix-demo
+ match:
+ hosts:
+ - apisix.deepflow.demo
+ paths:
+ - "/*"
+ backends:
+ - serviceName: web-shop
+ servicePort: 18090
+```
+
+#### 2.2.2 Enable the OpenTelemetry Plugin in APISIX
+
+Add OpenTelemetry plugins to the APISIX configuration:
+
+```
+## vim ./apisix/.values.yaml
+plugins:
+ - opentelemetry
+#...
+pluginAttrs:
+ opentelemetry:
+ resource:
+ service.name: APISIX
+ collector:
+ ## Send data to deepflow-agent
+ ## Of course, you can also send it to otel-collector for processing, and
then have otel-collector forward it to deepflow-agent
+ address: deepflow-agent.deepflow.svc.cluster.local/api/v1/otel/trace
+ request_timeout: 3
+
+## After adding, update helm upgrade --install -n apisix apisix ./apisix
+```
+
+Enable OpenTelemetry functionality for a specific route:
+
+```
+## View router id
+## Find the router id for the domain
+curl -s http://10.109.77.186:9180/apisix/admin/routes -H 'X-API-KEY: This is
apisix-admin token' | jq
+```
+
+```
+## Enable the otel feature for a specific route
+curl http://10.109.77.186:9180/apisix/admin/routes -H 'X-API-KEY: This is
apisix-admin token' -X PUT -d '
+{
+ "name": "deepflow-apisix-demo", ## Assign a name to this route
+ "methods": ["GET"],
+ "uris": ["/*"],
+ "plugins": {
+ "opentelemetry": {
+ "sampler": {
+ "name": "always_on"
+ },
+ "additional_attributes": [ ## Customize tags for span
through `additional_attributes`
+ "deepflow=demo"
+ ]
+ }
+ },
+ "upstream": {
+ "type": "roundrobin", ## Round Robin Load Balancing
+ "nodes": { ## Upstream Address
+ "10.1.23.200:18090": 1 ## Service access address:
Upstream ID
+ }
+ }
+}'
+```
+
+#### 2.2.3 Using DeepFlow to Integrate OpenTelemetry Traces
+
+The integration of OpenTelemetry Span data through DeepFlow Agent is enabled
by default and requires no additional configuration.
+
+```
+## View the default configuration of deepflow-agent
+## deepflow-ctl agent-group-config example
+
+## This parameter controls whether to enable receiving data from external
sources, including Prometheus, Telegraf, OpenTelemetry, and SkyWalking.
+## Data Integration Socket
+## Default: 1. Options: 0 (disabled), 1 (enabled).
+## Note: Whether to enable receiving external data sources such as Prometheus,
+## Telegraf, OpenTelemetry, and SkyWalking.
+#external_agent_http_proxy_enabled: 1
+```
+
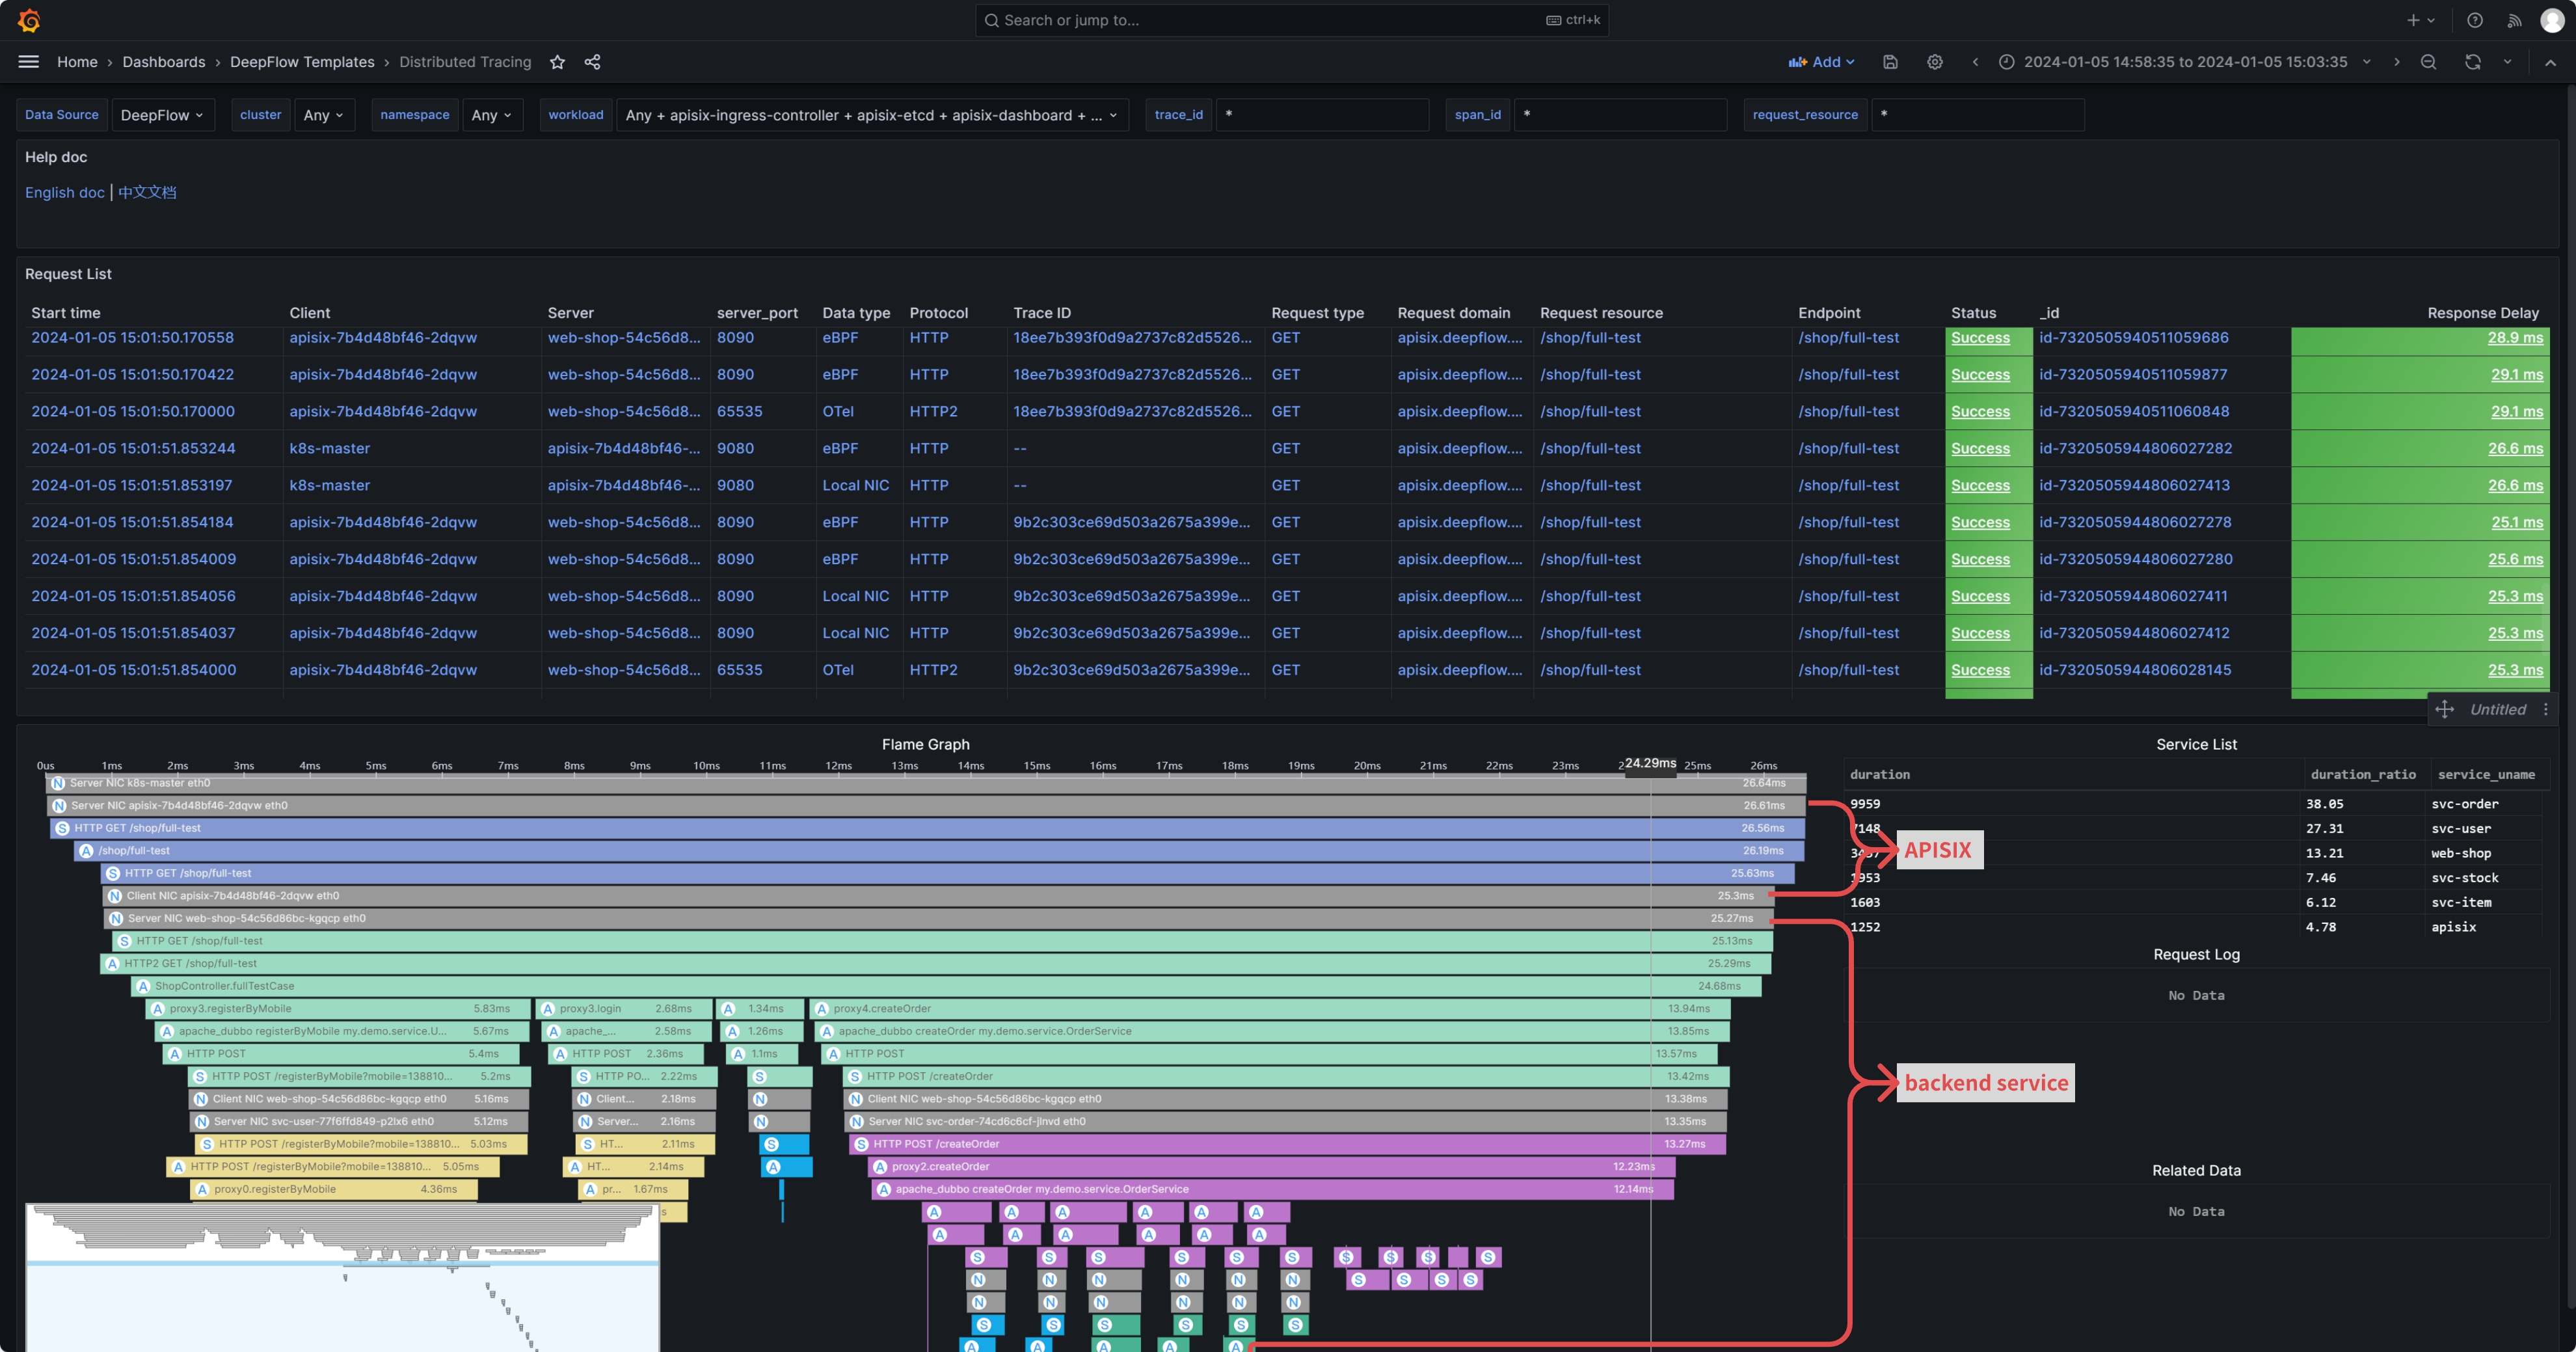
+#### 2.2.4 OpenTelemetry Integration Showcase
+
+We initiate a command from the client to access the WebShop service:
+
+```
+curl -H "Host: apisix.deepflow.demo" 10.1.23.200:44640/shop/full-test
+## Here, the IP is the K8s cluster node IP, and port 44640 is the NodePort
exposed by APISIX 9180.
+```
+
+Open the [Distributed Tracing Dashboard provided by
DeepFlow](https://ce-demo.deepflow.yunshan.net/d/Distributed_Tracing/distributed-tracing?orgId=1)
in Grafana, find the corresponding request, and initiate tracing. You'll be
able to see traces from both APISIX and the backend services. Moreover, the
application SPANs generated by APM and the network SPANs and system SPANs
generated by DeepFlow are all comprehensively associated on one flame graph:
+
+> Note: In the flame graph, "A" represents the application SPAN generated by
APM, while "N" and "S" represent the network SPAN and system SPAN generated by
DeepFlow, respectively.
+
+
+
+## 3. Performance Metrics
+
+DeepFlow offers immediate insights into metrics, featuring detailed RED (Rate,
Error, Duration) performance metrics at the endpoint level, along with
comprehensive TCP network performance metrics, including throughput,
retransmissions, zero window, and connection anomalies. Metrics from APISIX,
including HTTP status codes, bandwidth, connections, and latency, captured by
Metrics-type plugins like Prometheus and node-status, can also be integrated
into DeepFlow. This data, detailing both [...]
+
+
+
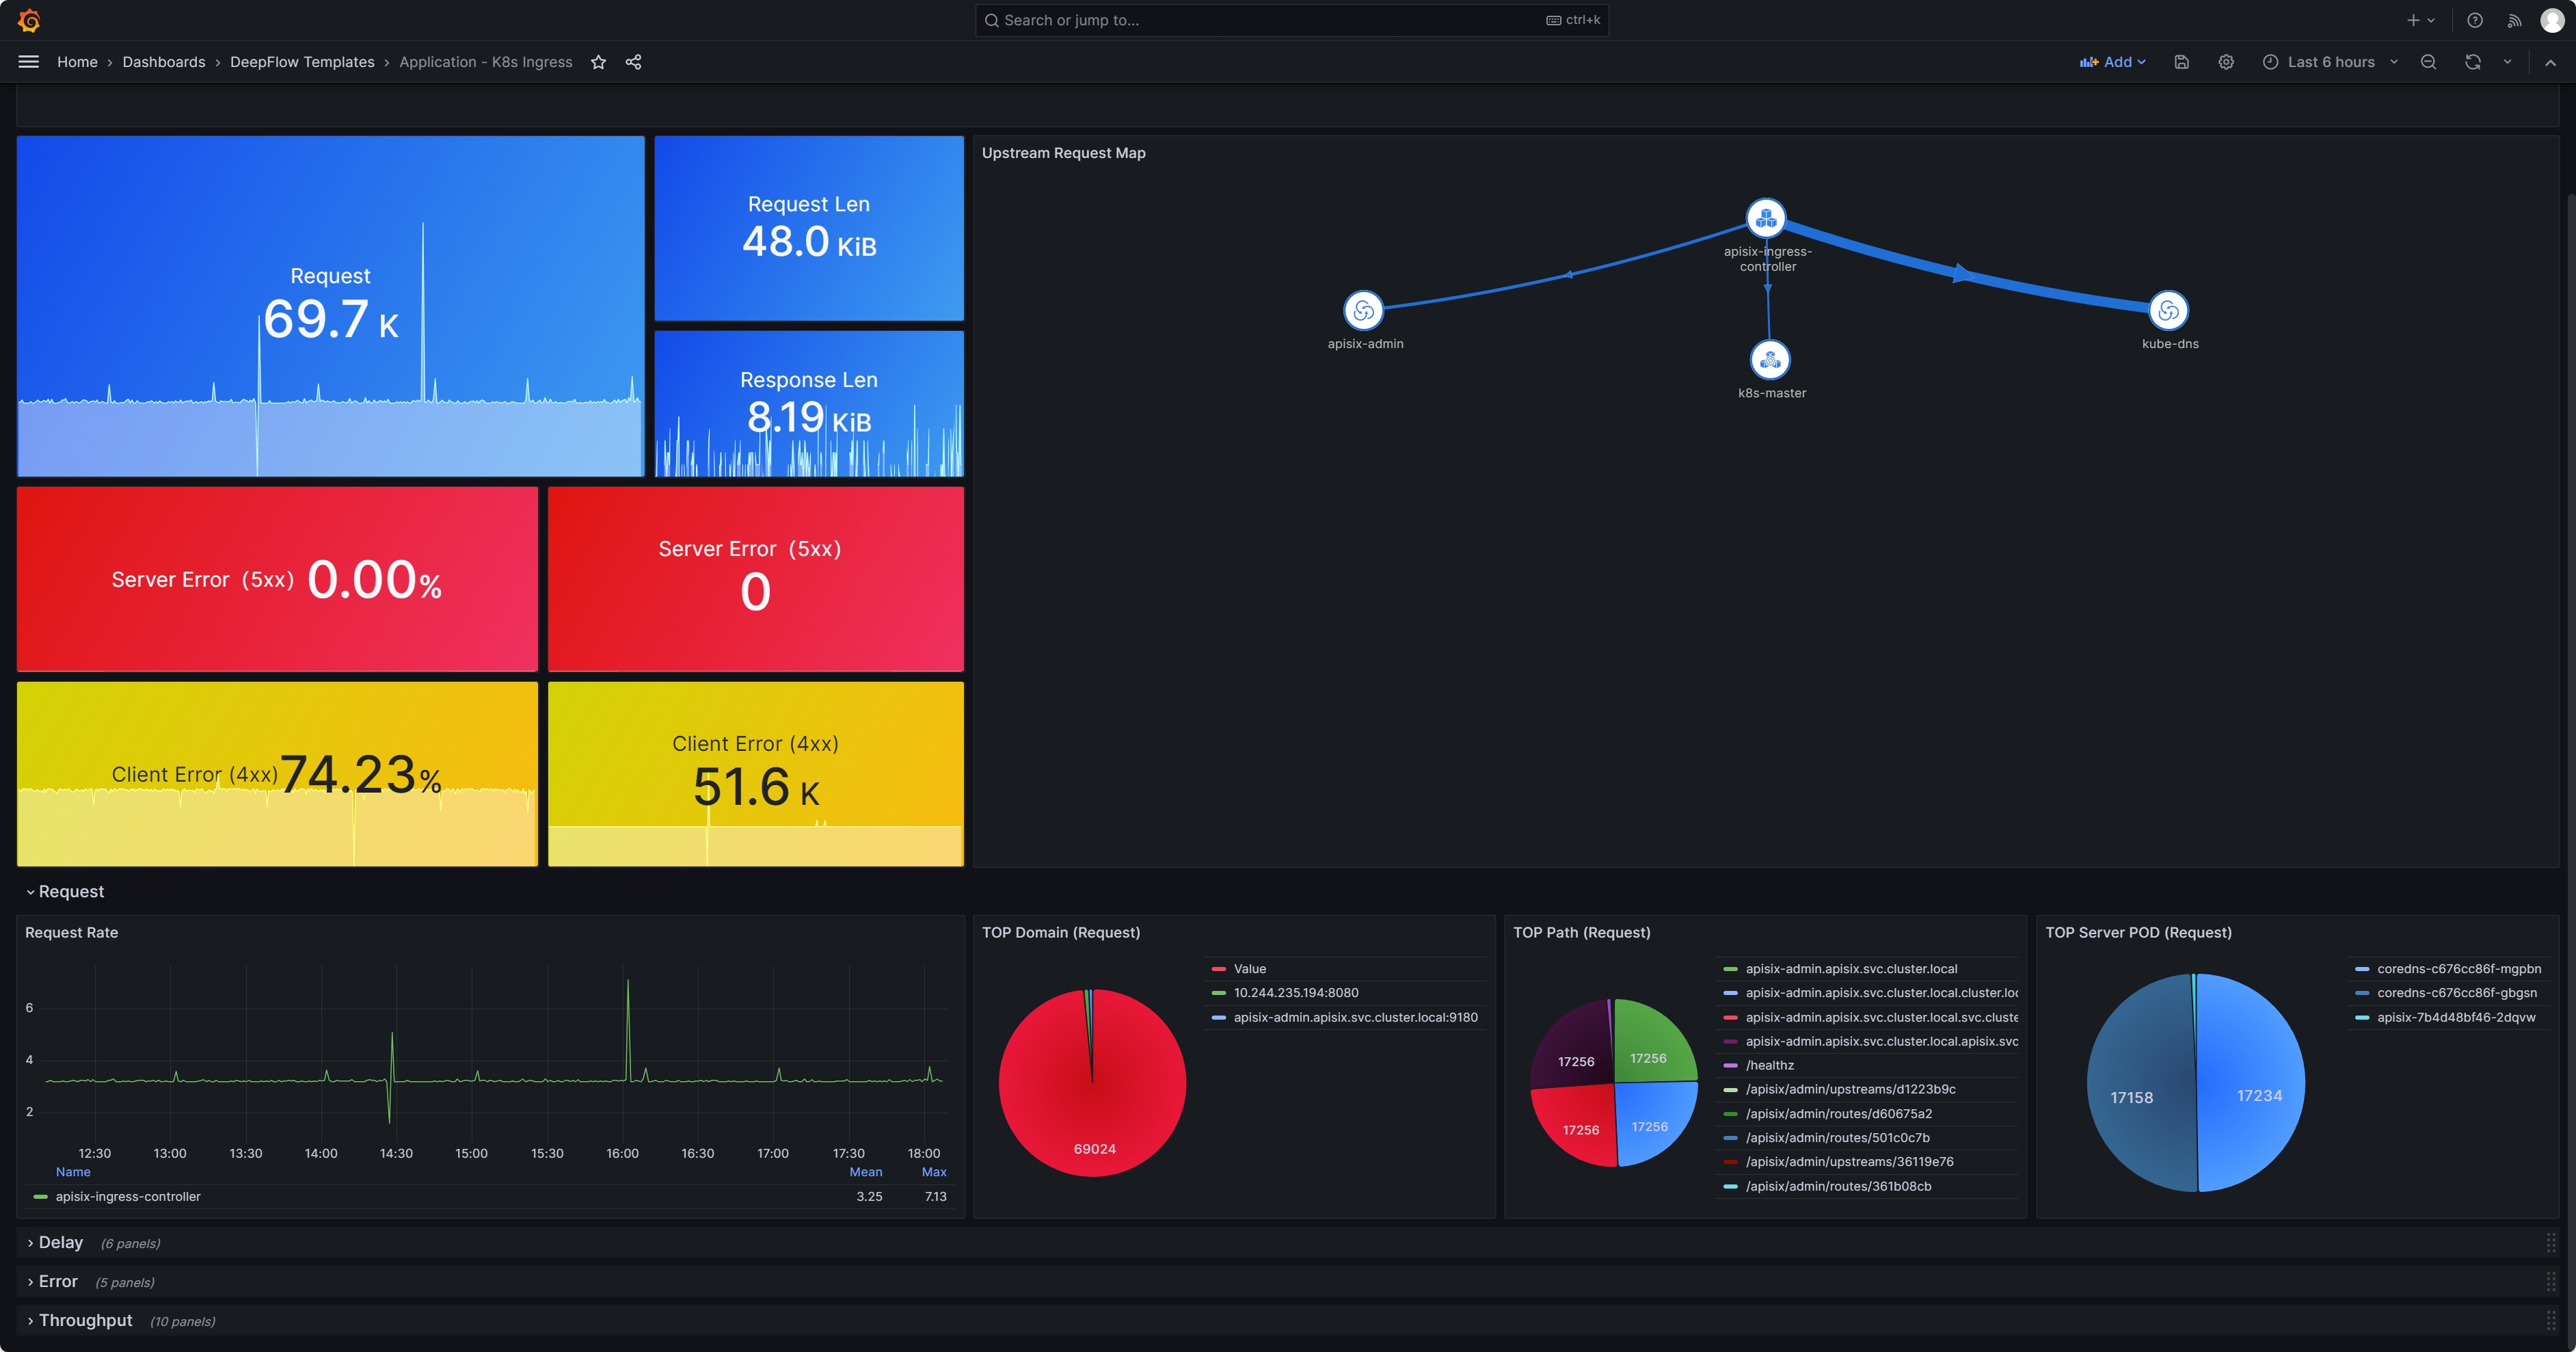
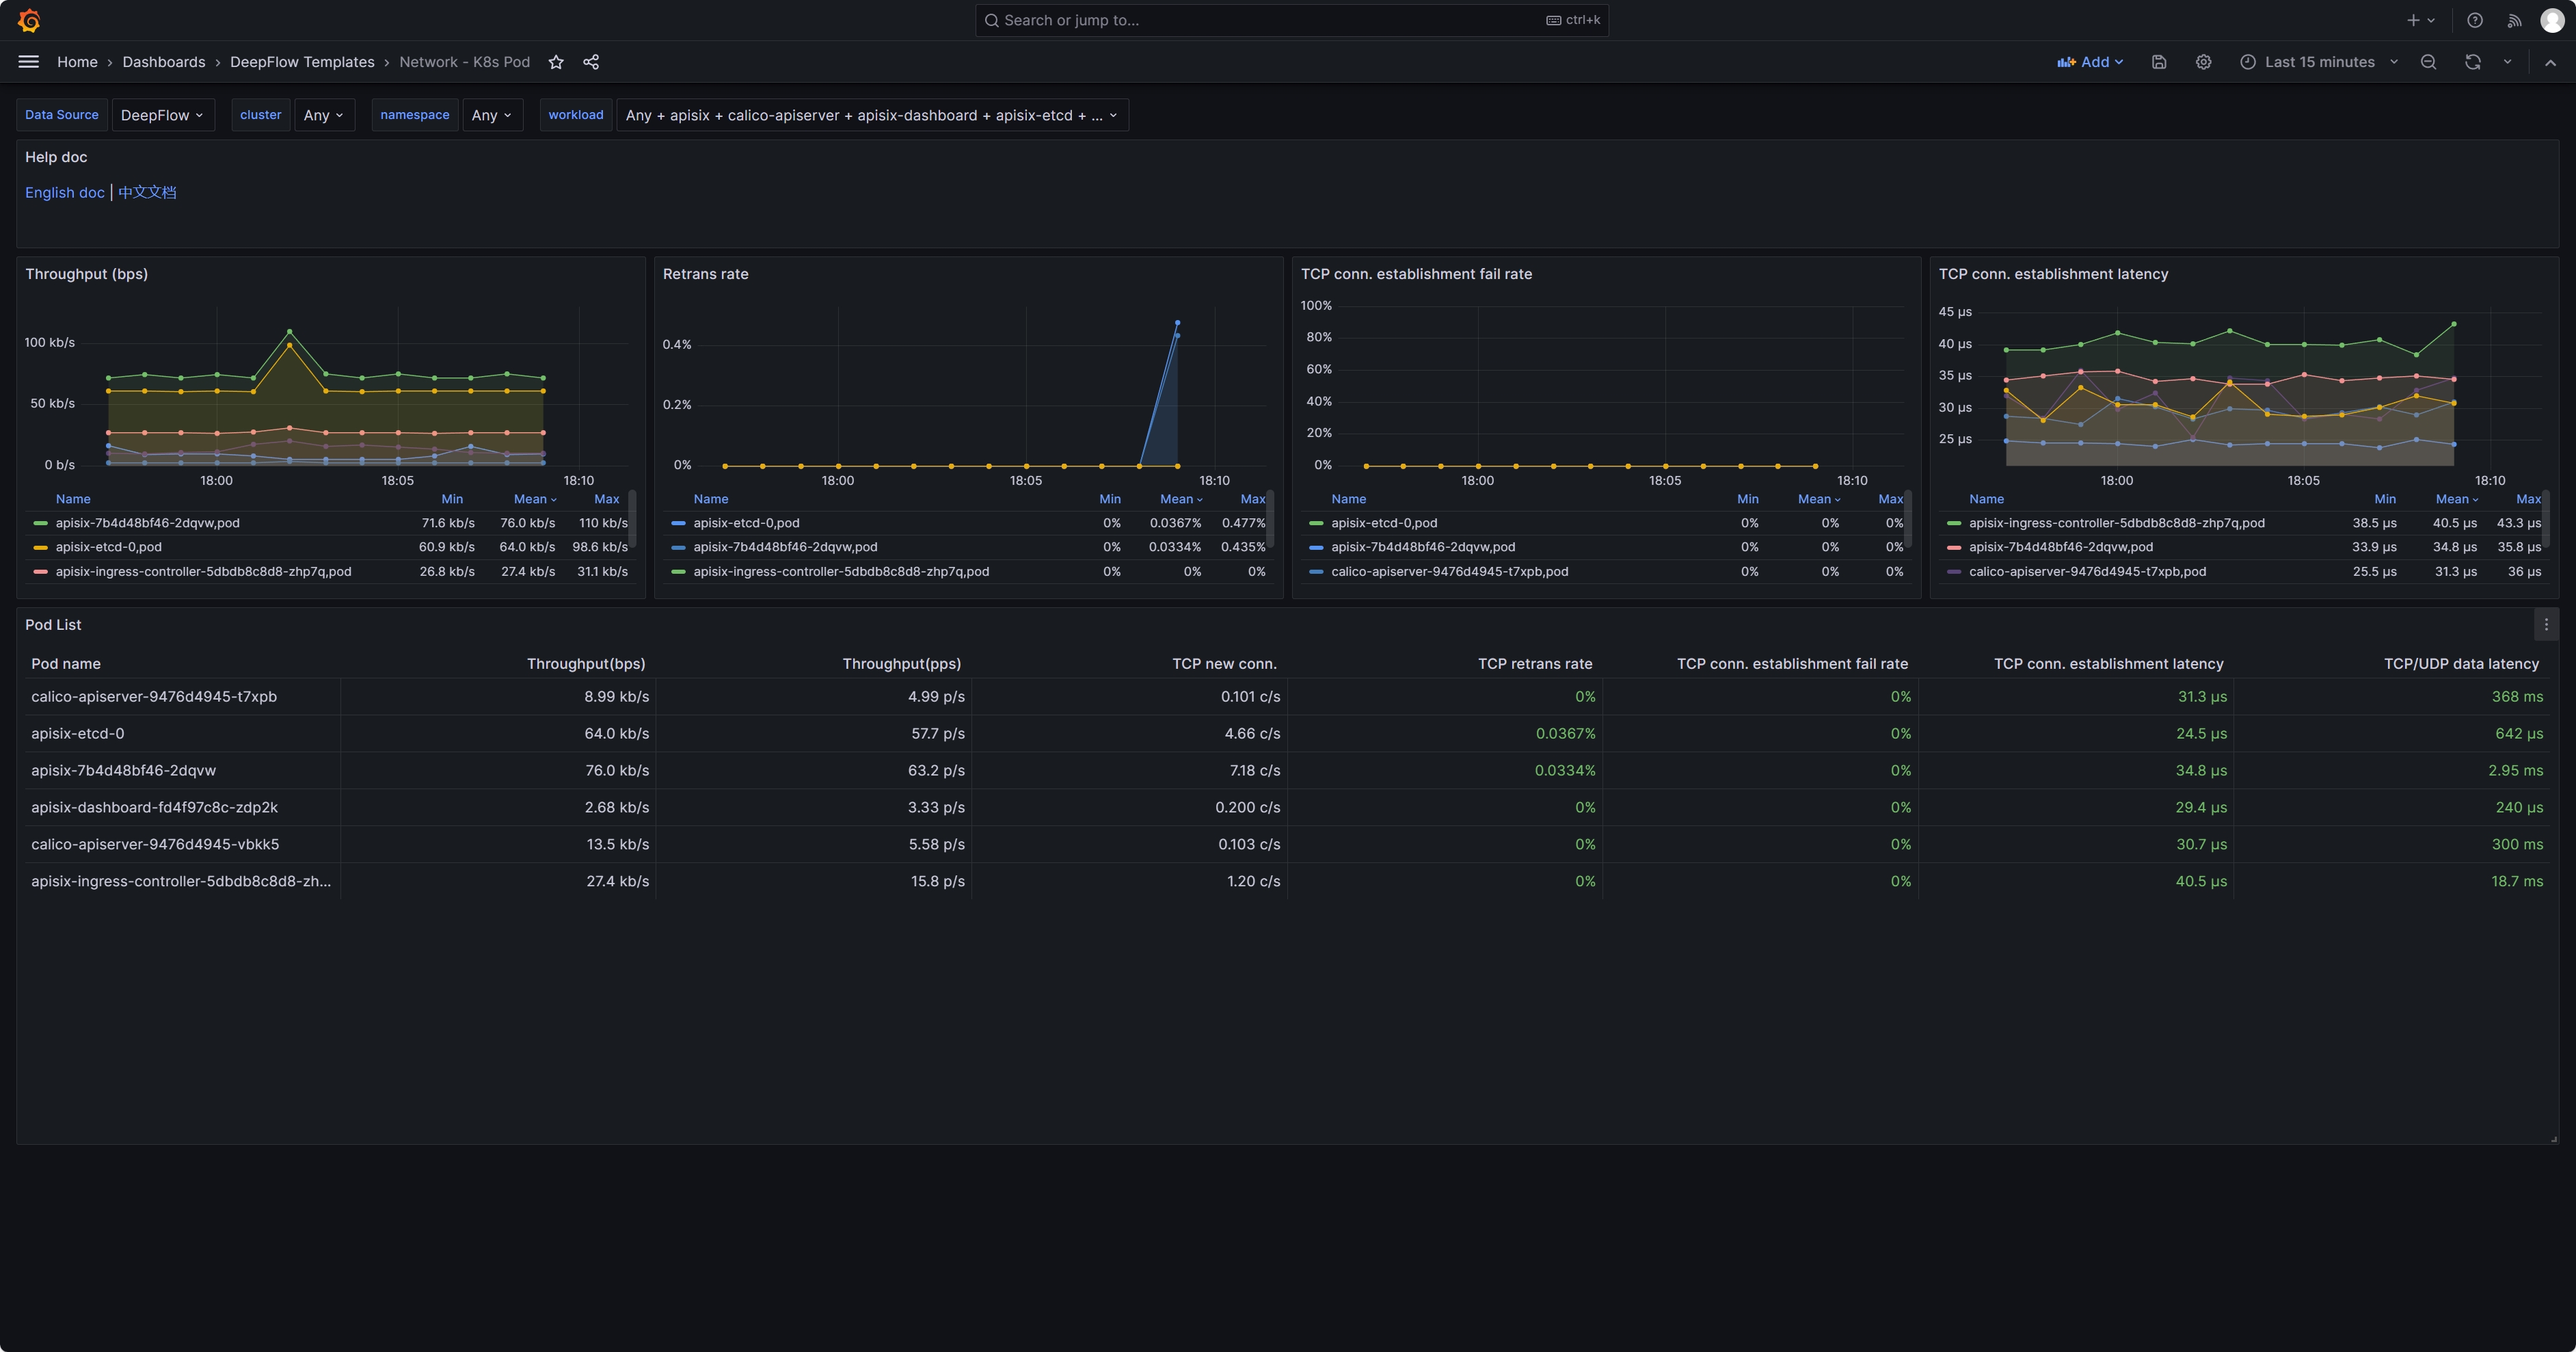
+### 3.1 Out-of-the-Box eBPF Metrics
+
+Once the deepflow-agent is deployed on the server hosting APISIX, it
automatically gathers highly detailed application and network level metrics.
This includes metrics such as request rates, response latencies, and error
statuses for specific clients or endpoints, as well as TCP connection setup
times, connection anomalies, and more. Detailed metrics can be found on [the
DeepFlow official website in the metrics
section](https://deepflow.io/docs/features/universal-map/metrics-and-operator
[...]
+
+
+
+
+
+### 3.2 Enable the Prometheus Plugin in APISIX
+
+Add the Prometheus plugin to the APISIX configuration:
+
+```
+## vim ./apisix/.values.yaml
+plugins:
+ - prometheus
+# ...
+pluginAttrs:
+ prometheus:
+ export_uri: /metrics ## The default URI is `/apisix/prometheus/metrics`
+ export_addr:
+ ip: 0.0.0.0 ## Scrape Address
+ port: 9091 ## Default port 9091
+ metrics:
+ http_status:
+ extra_labels:
+ - upstream_addr: $upstream_addr ## For example, add an
upstream server address (the variable here is an NGINX variable)
+ - upstream_status: $upstream_status ## For example, add the
status of an upstream server (the variable here is an NGINX variable)
+ ## APISIX Built-in Variables:
https://apisix.apache.org/docs/apisix/3.2/apisix-variable/
+ ## NGINX Built-in
Variables:https://nginx.org/en/docs/varindex.html
+```
+
+Enable Prometheus plugin:
+
+```
+## Note: Since the otel feature has been enabled above, here we need to enable
Prometheus on top of the otel functionality.
+
+curl http://10.109.77.186:9180/apisix/admin/routes/$router_id -H 'X-API-KEY:
$apisix-admin token' -X PUT -d '
+{
+ "name": "deepflow-apisix-demo", ## Assign a name to this route
+ "methods": ["GET"],
+ "uris": ["/*"],
+ "plugins": {
+ "prometheus":{ ## Enable Prometheus
+ "prefer_name": true ## When set to "true," the
Prometheus metrics will display the route/service name instead of the ID.
+ }
+ },
+ "upstream": {
+ "type": "roundrobin",
+ "nodes": {
+ "10.1.23.200:18090": 1
+ }
+ }
+}'
+```
+
+### 3.3 Collect APISIX Metrics with Prometheus
+
+Collecting APISIX metrics using Prometheus (example given using Prometheus CRD
deployment method):
+
+```
+## Collecting via ServiceMonitor Method (Prometheus deployed in Kubernetes as
a CRD)
+## The APISIX `values.yaml` file provides the corresponding module
+serviceMonitor:
+ ## Whether to enable
+ enabled: true
+ ## Which namespace to create in
+ namespace: "apisix"
+ ## ServiceMonitor name, defaults to fullname
+ name: ""
+ ## Scrape interval
+ interval: 15s
+ ## URI where metrics are exposed
+ path: /metrics
+ ## Prefix for the scraped metrics
+ metricPrefix: apisix_
+ ## Scrape port
+ containerPort: 9091
+ ## Add labels
+ labels:
+ ## For this deployment, the project uses kube-prometheus; use this label
for kube-prometheus to recognize the ServiceMonitor
+ app.kubernetes.io/part-of: kube-prometheus
+ annotations: {}
+```
+
+At this point, a Prometheus backend service is required to collect the metrics
generated by APISIX plugins. Therefore, it is necessary to deploy a
`prometheus-server` first. However, since these metrics do not rely on
prometheus-server for storage, it is possible to deploy a prometheus-server in
agent mode or use a lighter weight grafana-agent instead. Assuming that
prometheus-server has been deployed, enabling `RemoteWrite` will send metric
data to DeepFlow:
+
+```
+##
https://prometheus.io/docs/prometheus/latest/configuration/configuration/#remote_write
+##
https://deepflow.io/docs/zh/integration/input/metrics/prometheus/#配置-remote-write
+
+## Sending to DeepFlow via kube-prometheus (adding remote write in the YAML
manifest)
+apiVersion: monitoring.coreos.com/v1
+kind: Prometheus
+metadata:
+ labels:
+ ...
+ name: k8s
+ namespace: monitoring
+spec:
+ enableRemoteWriteReceiver: true
+ remoteWrite:
+ ## Note: Here should be the deepflow-agent service address, which needs to
be specified according to the actual location.
+ - url: "http://deepflow-agent.deepflow.svc.cluster.local/api/v1/prometheus";
+```
+
+### 3.4 Integrating Prometheus Metrics with DeepFlow
+
+Integrating Prometheus metrics through deepflow-agent is enabled by default
and requires no additional configuration.
+
+```
+## View the default configuration of deepflow-agent
+## deepflow-ctl agent-group-config example
+
+## This parameter controls whether to accept data from external sources,
including Prometheus, Telegraf, OpenTelemetry, and SkyWalking.
+## Data Integration Socket
+## Default: 1. Options: 0 (disabled), 1 (enabled).
+## Note: Whether to enable receiving external data sources such as Prometheus,
+## Telegraf, OpenTelemetry, and SkyWalking.
+#external_agent_http_proxy_enabled: 1
+```
+
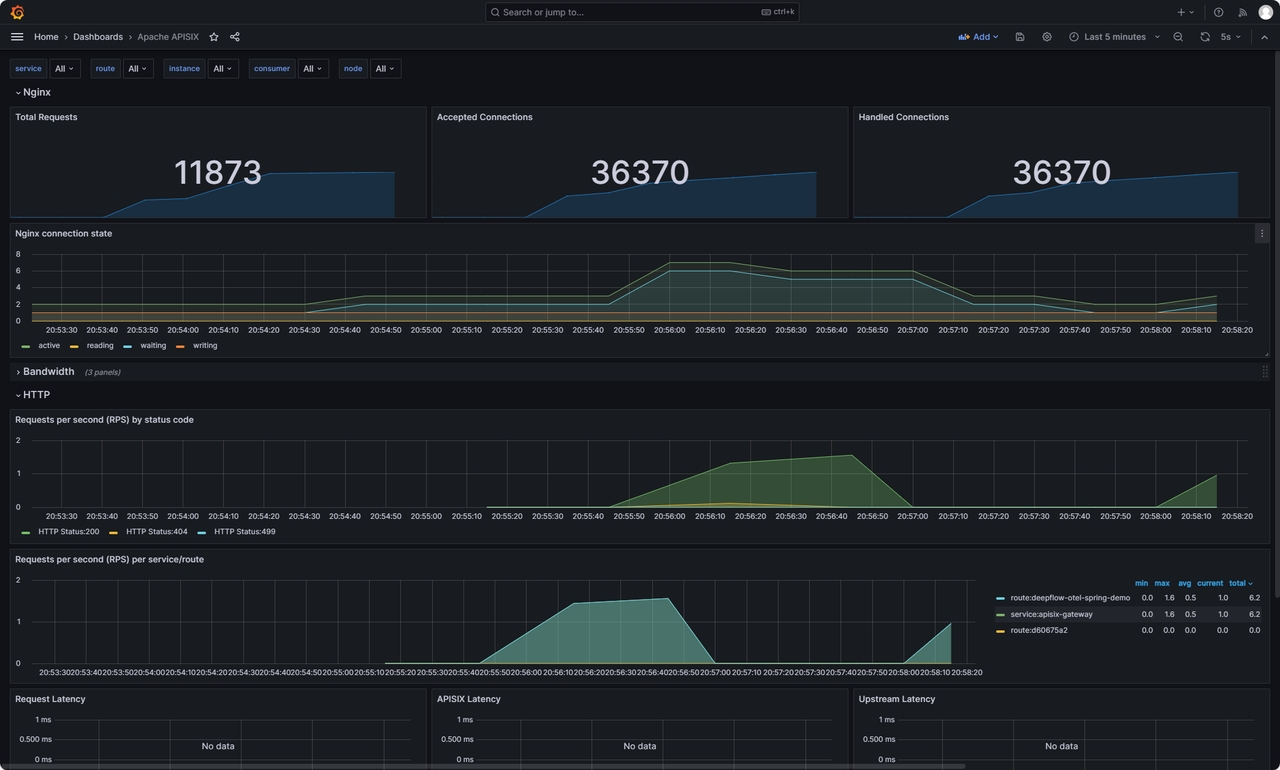
+### 3.5 Prometheus Integration Showcase
+
+Since DeepFlow supports PromQL, you only need to change the data-source in the
[Grafana
dashboard](https://github.com/apache/apisix/blob/master/docs/assets/other/json/apisix-grafana-dashboard.json)
provided by APISIX to DeepFlow. This way, you can view the rich performance
metrics natively provided by APISIX. For instructions on how to use these
metrics, refer to [the official documentation regarding the Prometheus
plugin](https://apisix.apache.org/docs/apisix/plugins/prometheus/).
+
+
+
+## 4. Access Logs and Continuous Profiling
+
+
+
+For access logs, there is no need for APISIX to be modified in any way. Simply
deploying deepflow-agent on the server where APISIX is located. By opening the
[Application - Request Log Dashboard provided by
DeepFlow](https://ce-demo.deepflow.yunshan.net/d/Application_Request_Log/application-request-log?orgId=1)
in Grafana, you can view the access logs, which include header information
from both the Request and Response. Additionally, you can analyze the response
latency and error codes f [...]
+
+
+
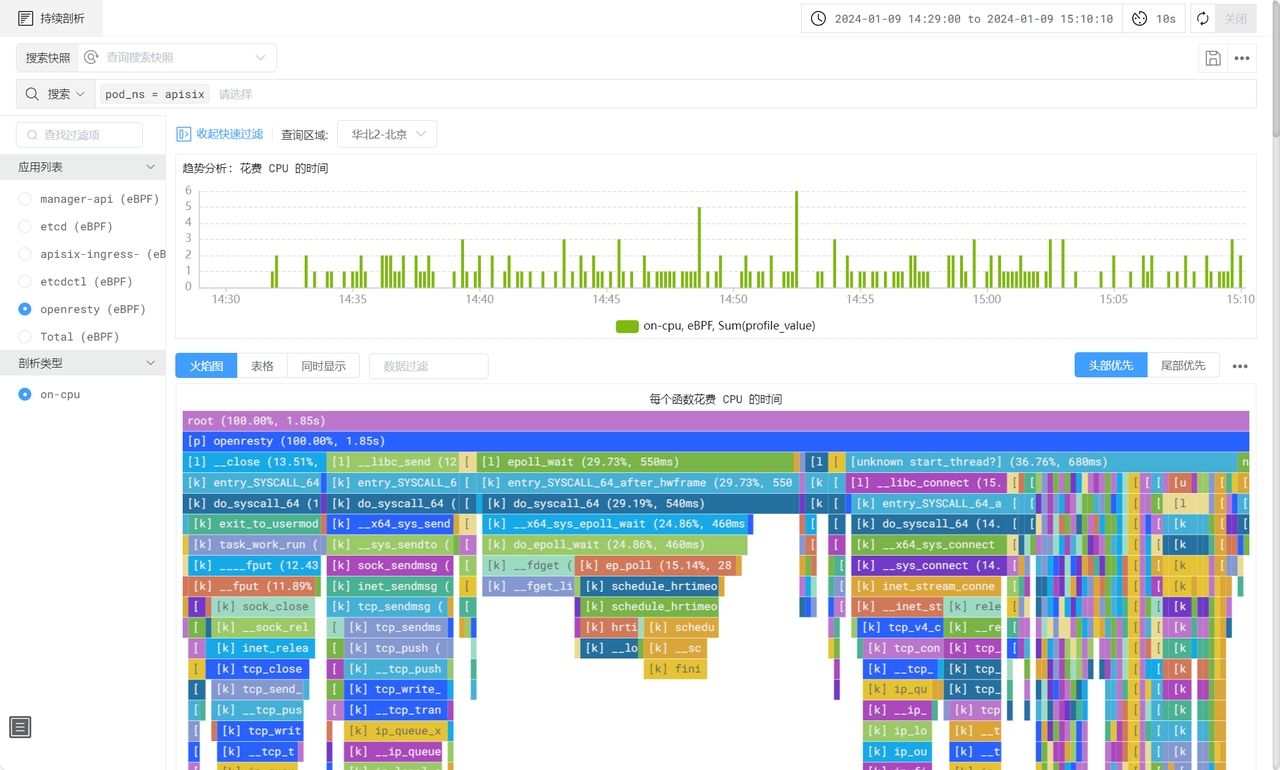
+DeepFlow also utilizes eBPF to capture function call stacks of applications, a
feature available in the enterprise edition. This functionality enables the
generation of an On-CPU Profile for the APISIX process, detailing the function
call stack. It encompasses not just application functions but also the time
spent in libraries and kernel syscalls.
+
+
+
+## 5. What is APISIX
+
+[Apache APISIX](https://apisix.apache.org/) is a dynamic, real-time,
high-performance open-source API gateway that provides rich traffic management
functions such as load balancing, dynamic upstream, canary release, circuit
breaking, authentication, and observability. Being built based on NGINX and
LuaJIT, Apache APISIX has ultra-high performance with a single-core QPS of up
to 23,000 and an average delay of only 0.2 milliseconds. It can solve problems
in traditional architecture, and at [...]
+
+As an API gateway, Apache APISIX has a wide range of application scenarios. It
can be applied to scenarios such as gateways, Kubernetes Ingress Controller,
and service mesh, and can help enterprises quickly and safely process API and
microservice traffic. At present, it has been tested and highly recognized by
worldwide enterprises and organizations such as Zoom, Airwallex, Lotus Cars,
vivo, and European Factory Platform.
+
+Open-sourced and donated by API7.ai to Apache Software Foundation in 2019,
Apache APISIX is now the most active API gateway project on GitHub addressing 1
Trillion+ API calls per day, which is still growing.
+
+GitHub
address:[https://github.com/apache/apisix](https://github.com/apache/apisix)
+
+## 6. What is DeepFlow
+
+DeepFlow, an open-source observability project, aims to deliver comprehensive
observability for complex cloud infrastructures and cloud-native applications.
Utilizing eBPF technology, it offers application performance metrics,
distributed tracing, and continuous profiling with zero-code instrumentation,
thanks to its integration of smart-encoding technology for full-stack
correlation. DeepFlow enables automatic deep observability for cloud-native
applications, easing developers' workload [...]
+
+GitHub
address:[https://github.com/deepflowio/deepflow](https://github.com/deepflowio/deepflow)
diff --git
a/blog/zh/blog/2024/02/07/unlock-observability-for-apisix-with-deepflow.md
b/blog/zh/blog/2024/02/07/unlock-observability-for-apisix-with-deepflow.md
new file mode 100644
index 00000000000..c9360525350
--- /dev/null
+++ b/blog/zh/blog/2024/02/07/unlock-observability-for-apisix-with-deepflow.md
@@ -0,0 +1,326 @@
+---
+title: "基于 DeepFlow 构建 APISIX 的统一可观测性能力"
+authors:
+ - name: 李倩
+ title: Author
+ - name: 彭斌
+ title: Author
+keywords:
+ - APISIX
+ - DeepFlow
+description: 本文旨在阐述如何利用 DeepFlow 基于 eBPF 的零侵扰特性构建 APISIX 可观测性解决方案。
+tags: [Ecosystem]
+image:
https://static.apiseven.com/uploads/2024/02/07/9QAMhtmJ_deepflow-cover.jpeg
+---
+
+> 本文旨在阐述如何利用 DeepFlow 基于 eBPF 的零侵扰特性构建 APISIX 可观测性解决方案。
+<!--truncate-->
+
+随着应用组件的可观测性逐渐受到重视,Apache APISIX
引入插件机制丰富了可观测数据源。然而,这些数据分散在多个平台,形成了数据孤岛。本文旨在阐述如何利用 DeepFlow 基于 eBPF 的零侵扰特性构建
APISIX 可观测性解决方案,在此基础上统一集成 APISIX 插件已有的丰富数据源,消除孤岛、构建统一的可观测性平台,以全面监控和分析 APISIX
网关。通过 DeepFlow,APISIX
可以实现从流量监控、追踪分析、到性能优化的全面可观测性,消除数据分散并提供中心化的监控视图,加速故障排查和性能调优,让 DevOps 和 SRE
团队的工作更加高效。本文将重点梳理 APISIX 的追踪数据、指标数据、访日日志及性能剖析数据如何对接 DeepFlow。
+
+
+
+## 1. 安装 APISIX 和 DeepFlow
+
+基于 DeepFlow 建构 APISIX 的统一可观测性能力,需要先将 DeepFlow 及 APISIX 都部署起来。本文为了方便,将 DeepFlow
和 APISIX 都以 K8s 服务的形式部署在一个 All-in-One 的 K8s 集群中,整个部署过程大概 5 分钟左右完成。详细的部署过程,参考
[DeepFlow
官方部署文档](https://apisix.apache.org/docs/apisix/3.2/installation-guide/)及 [APISIX
官方部署文档](https://deepflow.io/docs/zh/ce-install/all-in-one/)。
+
+> 注意:为了发挥 DeepFlow 基于 eBPF 的可观测性能力,请确保服务器 Linux 操作系统内核在 4.14 之上。
+
+## 2. 分布式追踪
+
+使用 DeepFlow 实现 APISIX 及后端服务的分布式追踪能力有两种方案:利用 eBPF,DeepFlow 可以在不修改 APISIX
及后端服务配置及代码的前提下实现开箱即用的 RPC 粒度分布式追踪;而当后端服务已具备 APM(Application Performance
Monitoring) 能力 —— 比如已经使用了 OpenTelemetry 或者 SkyWalking 等工具时,可结合 APISIX 的 Tracers
插件,将所有追踪数据统一集成到 DeepFlow,实现全链路的应用函数粒度的分布式追踪。
+
+
+
+### 2.1 方式一:DeepFlow eBPF AutoTracing
+
+DeepFlow 的分布式追踪(AutoTracing)能力是开箱即用的,无需 APISIX 开启任何插件,仅需要将 deepflow-agent 部署在
APSIX 所在的服务器即可。在 Grafana 中找到 DeepFlow 提供的 Distributed Tracing
Dashboard,即可对某一个调用点击发起追踪,并看到这个调用在 APISIX 及其后端服务中的全链路追踪过程。如下图所示:
+
+①:通过 nodeport 的形式访问到 APISIX 网关服务所在 K8s Node 的端口
+②:进入到 APISIX 网关服务所对应的 POD 的网卡
+③:进入到 APISIX 网关服务中的 OpenResty 进程
+④:完成业务处理,经由 OpenResty 进程将请求转发给后端服务
+⑤:经由 APISIX 网关服务所对应的 POD 网卡转发
+⑥/⑦:将请求转发给后端服务
+
+
+
+### 2.2 方式二:DeepFlow eBPF + OpenTelemetry
+
+此方式为 APISIX 利用 OpenTelemetry 插件生成 Trace 数据,后端服务也具备 APM 能力并且可将生成的 Trace 数据转化为
OpenTelemetry 格式。当 APISIX 与后端服务都将 Trace 数据发送给 DeepFlow 时,DeepFlow 能够生成包含 APM
`应用 SPAN`、eBPF `系统 SPAN`、cBPF `网络 SPAN` 的无盲点全栈调用链追踪火焰图。
+
+当我们希望得到应用进程内部函数粒度的分布式追踪链路,或者后端服务在处理一个调用时使用了线程池(会导致 DeepFlow AutoTracing
断链)时,可以采用这种方式。
+
+**2.2.1 部署具备 APM 能力的后端服务**
+
+为了展示完整的追踪效果,我们首先在 APISIX 网关后面部署了一个支持 OpenTelemetry 能力的 Demo 应用。Demo
应用的部署可参考:[DeepFlow Demo - 一键部署基于 Spring Boot 编写的五个微服务组成的 WebShop
应用](https://deepflow.io/docs/zh/integration/input/tracing/opentelemetry/#%E5%9F%BA%E4%BA%8E-spring-boot-demo-%E4%BD%93%E9%AA%8C)。在
APISIX 上创建访问后端服务的路由,访问域名为 apisix.deepflow.demo。
+
+```
+apiVersion: apisix.apache.org/v2
+kind: ApisixRoute
+metadata:
+ name: deepflow-apisix-demo
+ namespace: deepflow-otel-spring-demo
+spec:
+ http:
+ - name: deepflow-apisix-demo
+ match:
+ hosts:
+ - apisix.deepflow.demo
+ paths:
+ - "/*"
+ backends:
+ - serviceName: web-shop
+ servicePort: 18090
+```
+
+**2.2.2 在 APSIX 中开启 OpenTelemetry 插件**
+
+在 APISIX 配置中添加 opentelemetry plugins:
+
+```
+## vim ./apisix/.values.yaml
+plugins:
+ - opentelemetry
+#...
+pluginAttrs:
+ opentelemetry:
+ resource:
+ service.name: APISIX
+ collector:
+ ## 将数据传给 deepflow-agent
+ ## 当然,这里也可以发给 otel-collector 进行处理后,再由 otel-collectorf发送至 deepflow-agent
+ address: deepflow-agent.deepflow.svc.cluster.local/api/v1/otel/trace
+ request_timeout: 3
+
+## 添加后更新 helm upgrade --install -n apisix apisix ./apisix
+```
+
+针对指定路由开启 OpenTelemetry 功能:
+
+```
+## 查看路由 ID
+## 找到对应域名的路由 ID
+curl -s http://10.109.77.186:9180/apisix/admin/routes -H 'X-API-KEY: 此处为
apisix-admin token' | jq
+```
+
+```
+## 针对具体路由开启 otel 功能
+curl http://10.109.77.186:9180/apisix/admin/routes/此处为路由ID -H 'X-API-KEY: 此处为
apisix-admin token' -X PUT -d '
+{
+ "name": "deepflow-apisix-demo", ## 给这个路由配置个名字
+ "methods": ["GET"],
+ "uris": ["/*"],
+ "plugins": {
+ "opentelemetry": {
+ "sampler": {
+ "name": "always_on"
+ },
+ "additional_attributes": [ ## 可通过 additional_attributes 自定义
Span 标签
+ "deepflow=demo"
+ ]
+ }
+ },
+ "upstream": {
+ "type": "roundrobin", ## RR 轮询
+ "nodes": { ## 上游地址
+ "10.1.23.200:18090": 1 ## 服务访问地址:上游编号
+ }
+ }
+}'
+```
+
+**2.2.3 使用 DeepFlow 集成 OpenTelemetry 追踪数据**
+
+通过 DeepFlow Agent 集成 OpenTelemetry 的 Span 数据,功能默认开启,无需额外配置。
+
+```
+## 查看 deepflow-agent 默认配置
+## deepflow-ctl agent-group-config example
+
+## 这个参数控制是否启接收外部数据源,包括 Prometheus Telegraf OpenTelemetry 和 SkyWalking
+## Data Integration Socket
+## Default: 1. Options: 0 (disabled), 1 (enabled).
+## Note: Whether to enable receiving external data sources such as Prometheus,
+## Telegraf, OpenTelemetry, and SkyWalking.
+#external_agent_http_proxy_enabled: 1
+```
+
+**2.2.4 OpenTelemetry 集成效果展示**
+
+我们在客户端发起一条访问 WebShop 服务的命令:
+
+```
+curl -H "Host: apisix.deepflow.demo" 10.1.23.200:44640/shop/full-test
+## 此处 IP 为 k8s 集群节点 IP,44640 端口为 APISIX 9180 暴露的 NodePort
+```
+
+在 Grafana 中打开 DeepFlow 提供的 Distributed Tracing Dashboard,找到对应的调用点击发起追踪,能看到
APISIX 与后端服务都能追踪出来,且 APM 生成的应用 SPAN 与 DeepFlow 生成的网络 SPAN 及系统 SPAN
都完整的关联在一张火焰图上:
+
+> 注:火焰图中的 A 表示 APM 生成的应用 SPAN,N 和 S 表示 DeepFLow 生成的网络 SPAN 及系统 SPAN。
+
+
+
+## 3. 性能指标
+
+对于性能指标,在 DeepFlow 中同样能开箱即用查看 Endpoint 粒度的 RED(吞吐、时延、异常)性能指标,以及丰富的 TCP
网络性能指标(吞吐、重传、零窗、建连异常等)。同样,APISIX 的 Metrics 类的插件 —— 比如 Prometheus、node-status
等插件获取到的实例、路由粒度的 HTTP 状态码、带宽、连接数、时延等指标数据,可集成到 DeepFlow 中,并在 APISIX 提供的 Grafana
Dashboard 中查看。
+
+
+
+### 3.1 开箱即用的 eBPF 性能指标
+
+在 APISIX 所在的服务器上部署 deepflow-agent 后,可自动采集应用及网络层面非常细粒度的指标量,例如精细到某个客户端、某个
Endpoint 的请求速率、响应时延、异常状态;某一次 TCP 建连时延,建连异常等等。详细的指标量可参考 [DeepFlow
官网关于指标量的介绍](https://deepflow.io/docs/zh/features/universal-map/metrics-and-operators/)。在
Grafana 中打开 DeepFlow 提供的 Applicaiton - xxx Ingress Dashboard,可查看 APISIX
相关的应用层性能指标,在 Network xxx Dashboard 中可查看网络相关的指标。
+
+
+
+
+
+### 3.2 在 APISIX 中开启 Prometheus 插件
+
+在 APISIX 配置中添加 Prometheus 插件:
+
+```
+## vim ./apisix/.values.yaml
+plugins:
+ - prometheus
+# ...
+pluginAttrs:
+ prometheus:
+ export_uri: /metrics ## 默认 uri 为 /apisix/prometheus/metrics
+ export_addr:
+ ip: 0.0.0.0 ## 抓取地址
+ port: 9091 ## 默认端口 9091
+ metrics:
+ http_status: ## 具体作用在 apisix_http_status 指标中
+ extra_labels: ## 添加额外内容
+ - upstream_addr: $upstream_addr ##
例如此处添加一个上游服务器地址(此处的变量是NGINX变量)
+ - upstream_status: $upstream_status ##
例如此处添加一个上游服务器状态(此处的变量是NGINX变量)
+ ## APISIX
自带变量:https://apisix.apache.org/docs/apisix/3.2/apisix-variable/
+ ## NGINX
自带变量:https://nginx.org/en/docs/varindex.html
+```
+
+启用 Prometheus 插件:
+
+```
+## 注:上面启用了 otel 功能,所以此处要在启用 otel 的基础上开启 prometheus
+
+curl http://10.109.77.186:9180/apisix/admin/routes/此处为路由ID -H 'X-API-KEY: 此处为
apisix-admin token' -X PUT -d '
+{
+ "name": "deepflow-apisix-demo", ## 给这个路由配置个名字
+ "methods": ["GET"],
+ "uris": ["/*"],
+ "plugins": {
+ "prometheus":{ ## 启用 prometheus
+ "prefer_name": true ## 为"true"时,Prometheus
指标中,打印路由/服务名称而不是 ID
+ }
+ },
+ "upstream": {
+ "type": "roundrobin",
+ "nodes": {
+ "10.1.23.200:18090": 1
+ }
+ }
+}'
+```
+
+### 3.3 使用 Prometheus 拉取 APISIX 指标数据
+
+Prometheus 采集 APISIX metrics(此处以 Prometheus CRD 部署方式举例):
+
+```
+## ServiceMonitor 方式采集 (Prometheus 以 CRD 形式部署在 k8s 中)
+## APISIX values.yaml 文件中提供了对应模块
+serviceMonitor:
+ ## 是否启用
+ enabled: true
+ ## 创建在哪个命名空间
+ namespace: "apisix"
+ ## servicemonitor 名称,默认为 fullname
+ name: ""
+ ## 抓取间隔
+ interval: 15s
+ ## metrics 暴露的 uri
+ path: /metrics
+ ## 给抓取到的指标添加前缀
+ metricPrefix: apisix_
+ ## 抓取端口
+ containerPort: 9091
+ ## 添加 labels
+ labels:
+ ## 此次使用项目为 kube-prometheus,使用此标签使 kube-prometheus 识别 servicemonitor
+ app.kubernetes.io/part-of: kube-prometheus
+ annotations: {}
+```
+
+此时需要一个 Prometheus 后端服务用于采集 APISIX 插件生成的指标,所以需要先部署一个
prometheus-server。但实际上由于不依赖 prometheus-server 存储这些指标,因此可以部署一个 Agent Mode 的
prometheus-server,或者使用更加轻量级的 grafana-agent 替代 prometheus-server。假设已经部署了
prometheus-server,开启 RemoteWrite 可将指标数据发送给 DeepFlow:
+
+```
+##
https://prometheus.io/docs/prometheus/latest/configuration/configuration/#remote_write
+##
https://deepflow.io/docs/zh/integration/input/metrics/prometheus/#配置-remote-write
+
+## kube-prometheus 方式发送至 DeepFlow (yaml 清单中添加远程写入)
+apiVersion: monitoring.coreos.com/v1
+kind: Prometheus
+metadata:
+ labels:
+ ...
+ name: k8s
+ namespace: monitoring
+spec:
+ enableRemoteWriteReceiver: true
+ remoteWrite:
+ ## 注:此处为 deepflow-agent svc 地址,要按实际位置写
+ - url: "http://deepflow-agent.deepflow.svc.cluster.local/api/v1/prometheus";
+```
+
+### 3.4 使用 DeepFlow 集成 Prometheus 指标数据
+
+通过 DeepFlow Agent 集成 Prometheus 指标数据,功能默认开启,无需额外配置。
+
+```
+## 查看 deepflow-agent 默认配置
+## deepflow-ctl agent-group-config example
+
+## 这个参数控制是否启接收外部数据源,包括 Prometheus Telegraf OpenTelemetry 和 SkyWalking
+## Data Integration Socket
+## Default: 1. Options: 0 (disabled), 1 (enabled).
+## Note: Whether to enable receiving external data sources such as Prometheus,
+## Telegraf, OpenTelemetry, and SkyWalking.
+#external_agent_http_proxy_enabled: 1
+```
+
+### 3.5 Prometheus 集成效果展示
+
+由于 DeepFlow 支持 PromQL,只需要将 Grafana 中 APISIX 提供的 [Grafana
Dashboard](https://github.com/apache/apisix/blob/master/docs/assets/other/json/apisix-grafana-dashboard.json)
的数据源改为 DeepFlow,即可查看 APISIX 原生的丰富性能指标了,指标的使用说明参考[官方文档中关于 Prometheus
插件的说明](https://apisix.apache.org/docs/apisix/plugins/prometheus/)。
+
+
+
+## 4. 访问日志和持续剖析
+
+
+
+对于访问日志,此时无需 APISIX 做什么修改,仅需要将 deepflow-agent 部署在 APSIX 所在的服务器即可,在 Grafana 中打开
DeepFlow 提供的 Application - Request Log Dashboard 即可查看访问日志,包含了 Request 及
Response 中 header 信息,并可分析每一次请求的响应时延和错误码。
+
+
+
+DeepFlow 还通过 eBPF 获取应用程序的函数调用栈快照(企业版功能),可绘制 APISIX 进程的 On-CPU
Profile,函数调用栈中除了包含业务函数以外,还可展现动态链接库、内核系统调用函数的耗时情况。
+
+
+
+## 5. 什么是 APISIX
+
+Apache APISIX 是一个动态、实时、高性能的开源 API
网关,提供负载均衡、动态上游、灰度发布、服务熔断、身份认证、可观测性等丰富的流量管理功能。Apache APISIX 基于 NGINX 和 LuaJIT
构建,具有超高性能,单核 QPS 高达 23000,平均延迟仅为 0.2 毫秒。
+
+Apache APISIX 的应用场景非常广泛,可应用于 API 网关、Kubernetes Ingress 和服务网格等场景,帮助企业快速、安全地处理
API 和微服务流量。目前已获得 Zoom、Airwallex、Lotus Cars、vivo、欧洲数字工厂等全球企业和组织的测试和高度认可。
+
+Apache APISIX 于 2019 年开源并由 [API7.ai](https://api7.ai/) 捐赠给 Apache 软件基金会,目前是
GitHub 上最活跃的 API 网关项目,每天处理超万亿次的 API 调用,并且这一数字仍在增长。
+
+GitHub 地址:[https://github.com/apache/apisix](https://github.com/apache/apisix)
+
+## 6. 什么是 DeepFlow
+
+DeepFlow 是云杉网络开发的一款可观测性产品,旨在为复杂的云基础设施及云原生应用提供深度可观测性。DeepFlow 基于 eBPF
实现了应用性能指标、分布式追踪、持续性能剖析等观测信号的零侵扰(Zero
Code)采集,并结合智能标签(SmartEncoding)技术实现了所有观测信号的全栈(Full Stack)关联和高效存取。使用
DeepFlow,可以让云原生应用自动具有深度可观测性,从而消除开发者不断插桩的沉重负担,并为 DevOps/SRE 团队提供从代码到基础设施的监控及诊断能力。
+
+GitHub
地址:[https://github.com/deepflowio/deepflow](https://github.com/deepflowio/deepflow)
+
+访问 [DeepFlow
Demo](https://deepflow.io/docs/zh/ce-install/overview/),体验零插桩、全覆盖、全关联的可观测性。