This is an automated email from the ASF dual-hosted git repository.

Yilialinn pushed a commit to branch master
in repository https://gitbox.apache.org/repos/asf/apisix-website.git
The following commit(s) were added to refs/heads/master by this push:
new 3d5b08bcd1a blog: add APISIX throughput regression investigation (en +
zh) (#2115)
3d5b08bcd1a is described below
commit 3d5b08bcd1aebca5eeb8356c72fb99bda3641506
Author: Yilia Lin <[email protected]>
AuthorDate: Mon Aug 31 11:48:53 2026 +0800
blog: add APISIX throughput regression investigation (en + zh) (#2115)
---
.../28/debugging-apisix-throughput-regression.md | 232 ++++++++++++++++++++
.../28/debugging-apisix-throughput-regression.md | 234 +++++++++++++++++++++
2 files changed, 466 insertions(+)
diff --git a/blog/en/blog/2026/08/28/debugging-apisix-throughput-regression.md
b/blog/en/blog/2026/08/28/debugging-apisix-throughput-regression.md
new file mode 100644
index 00000000000..a6dad29b8f0
--- /dev/null
+++ b/blog/en/blog/2026/08/28/debugging-apisix-throughput-regression.md
@@ -0,0 +1,232 @@
+---
+title: "APISIX Throughput Regression: Beyond the Flame Graph"
+authors:
+ - name: "Xin Rong"
+ title: "Author"
+ url: "https://github.com/AlinsRan";
+ image_url: "https://github.com/AlinsRan.png";
+ - name: "Yilia Lin"
+ title: "Technical Writer"
+ url: "https://github.com/Yilialinn";
+ image_url: "https://github.com/Yilialinn.png";
+keywords:
+ - Apache APISIX
+ - flame graph
+ - LuaJIT
+ - performance optimization
+ - throughput regression
+description: "An APISIX throughput regression showed why the widest
flame-graph path did not explain the full throughput drop—and how CPU data,
call stacks, LuaJIT events, and paired A/B tests exposed costs that hotspot
ranking missed."
+tags: [Ecosystem]
+---
+
+The flame graph didn't lie, but it didn't explain the full throughput drop
either. In this APISIX regression, two additional paths worth investigating had
Lua self-time shares of only 3.0% and 3.9% among samples with Lua context.
+
+<!--truncate-->
+
+If we had ranked hotspots by size alone, neither path would have been
investigated first. We found them by following a sequence of checks: confirm
that the worker is CPU-bound, compare flame-graph widths, follow repeated call
paths, inspect LuaJIT compilation and aborts when the flame graph does not
explain the end-to-end throughput gap, then use per-request call counts and
paired A/B tests to measure the impact.
+
+> **Data scope:** The data below comes from one internally customized APISIX
build in the same controlled environment, with more than 100 plugins loaded.
Throughput is normalized and shown only to explain how we isolated the cause.
It does not represent the general performance of Apache APISIX OSS under other
hardware, configurations, or workloads.
+
+## 1. Confirm the Worker Is CPU-Bound
+
+A flame graph shows where the CPU spent its sampled time. Its width can
explain a throughput drop only when the target worker is close to saturation
and that core is the bottleneck.
+
+Before collecting the profile, we held the following conditions constant:
+
+- APISIX ran with a single worker pinned to a dedicated physical core.
+- The upstream service and load generator ran on other cores to avoid CPU
contention.
+- The request model, configuration, and response content remained unchanged.
+- The regression reproduced consistently. Error rates and responses did not
drift.
+- The target worker remained close to saturation, while the upstream service,
network, and load generator still had headroom.
+
+If any of these conditions is not met, start with connections, the network,
the upstream service, or the load generator—not an on-CPU flame graph.
+
+## 2. Read Width, Not Rank
+
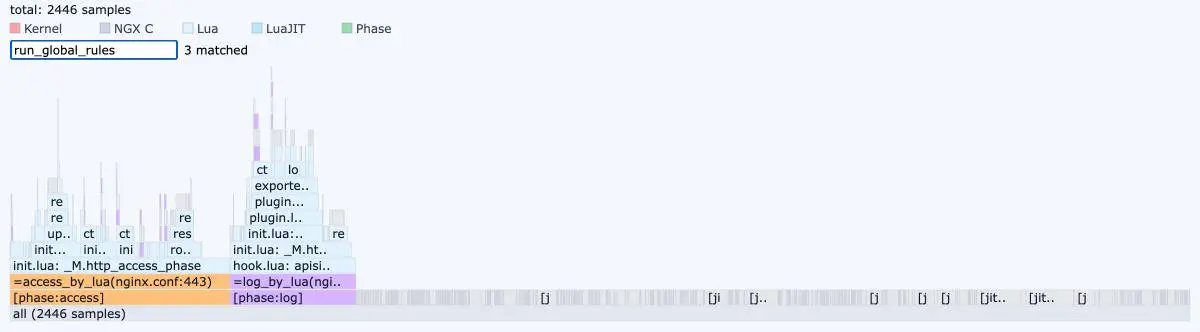
+We used eBPF to sample C and Lua call stacks simultaneously at 500 Hz. Here is
the Lua on-CPU flame graph from the investigation.
+
+
+
+Figure 1: Full view of the Lua on-CPU flame graph. Searching for
`run_global_rules` produced 3 matches, none of which stood out in the full
graph. The original profile contained 2,446 samples; process PIDs were removed
from the screenshot.
+
+In a flame graph, x-axis position does not imply order. Width reflects how
many samples landed on a path. Ranked by Lua self time, the initial candidates
were:
+
+| Candidate location | Lua self time | Initial assessment |
+|---|---:|---|
+| Prometheus exporter | 25.9% | Highest-priority candidate |
+| `ctx.var` metamethod | 15.1% | Second candidate |
+| Custom logging bypass | 3.9% | Easy to overlook |
+| `run_global_rules` | 3.0% | Easy to overlook |
+
+Here, self time is the share of samples with Lua context that landed directly
at a location—not a share of total CPU time. About 19.6% of the samples lacked
Lua context, so these percentages are useful for selecting candidates, not
predicting throughput gains.
+
+This ranking has four blind spots:
+
+1. When LuaJIT executes interpreted code, different Lua code paths may
collapse into shared `lj_BC_*` and `lj_vm_*` symbols.
+2. Compiled JIT traces cannot always be fully expanded by conventional stack
unwinding, so observable JIT samples provide only a lower bound.
+3. Costs such as table lookups, memory allocation, and garbage collection are
attributed to C symbols rather than to the Lua lines that triggered them.
+4. A call can change the caller's JIT state, making the resulting cost appear
at the caller's function entry.
+
+There was another clue: `run_global_rules` did not appear as one obvious
hotspot. It appeared across stacks from several request phases. No single
occurrence was wide, but the combined cost could still be substantial.
+
+## 3. How a 3.0% Lua Self-Time Share Gets Amplified
+
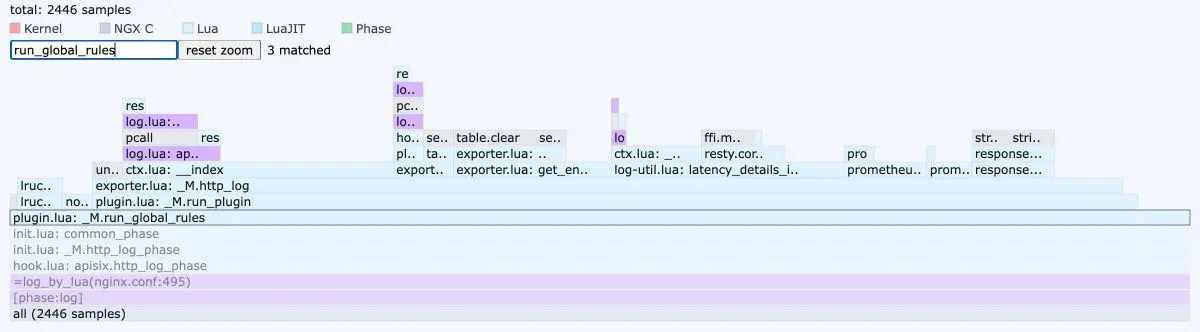
+When we selected a `run_global_rules` frame and followed the stack upward, we
saw the request-phase entry point at the bottom, followed by `common_phase`,
Global Rule plugin filtering, dispatch, and finally individual plugin execution.
+
+
+
+Figure 2: Interactive zoomed view after selecting one `run_global_rules`
stack. The selected stack is stretched to fill the canvas, so its width is
normalized and must not be interpreted as its share of total CPU time. Click
the image to view it at full size.
+
+Stack height does not represent elapsed time. It shows where the cost enters,
who invokes it, and why the path executes repeatedly.
+
+Before the fix, `run_global_rules()` called `_M.filter()` in several request
phases. `_M.filter()` iterated through every loaded plugin and checked each one
to determine whether it had been configured in the Global Rule:
+
+```lua
+-- Simplified illustration, not the complete APISIX implementation
+for _, plugin_obj in ipairs(local_plugins) do
+ local name = plugin_obj.name
+ local plugin_conf = user_plugin_conf[name]
+ if type(plugin_conf) ~= "table" then
+ goto continue
+ end
+ -- Process configured plugins
+ ::continue::
+end
+```
+
+Two factors amplified the cost:
+
+1. The cost of each filtering pass increased with the number of loaded plugins.
+2. The same filtering result was regenerated across request phases. The
`body_filter` and `delayed_body_filter` phases could also be entered multiple
times for response-body chunks.
+
+In this test configuration, one request triggered 9 filtering passes. The same
request scanned more than 100 loaded plugins 9 times to find the same small set
of configured plugins.
+
+This explains why a Lua-level self time of 3.0% understated the cost of the
entire path:
+
+| Actual work | Common flame-graph attribution |
+|---|---|
+| The loop itself | Corresponding location in `plugin.lua` |
+| Large numbers of table lookups | `lj_BC_TGETS` |
+| Temporary table allocation | `lj_alloc_malloc` |
+| Garbage collection of temporary objects | `gc_sweep` |
+| Uncompiled interpreter dispatch | `lj_vm_*` / `lj_BC_*` |
+
+At 3% self time, this path looked minor. Following the stack showed that it
sat on a shared path entered repeatedly. The fix was to reuse the filtered
plugin set within the same request whenever the Global Rule and matched route
had not changed, rather than rebuild it in every phase.
+
+## 4. When the Flame Graph Cannot Explain the Gap, Check LuaJIT
+
+The second lead came from a custom observability component. Neither the
component nor its logging bypass is part of APISIX OSS, but the failure mode
matters to APISIX plugins and OpenResty extensions: a seemingly inexpensive
call can add direct cost and change how subsequent caller code executes—through
the interpreter or as machine code.
+
+### 4.1 Interpreter Dispatch Was Abnormally Active
+
+After reclassifying the C-level samples by runtime category, the clearest
signal was how much time appeared under interpreter dispatch compared with
observable JIT execution:
+
+| Runtime category | CPU time per request | Share of samples |
+|---|---:|---:|
+| Interpreter dispatch: `lj_BC_*` / `lj_vm_*` | 5.86 μs | 29.6% |
+| Observable JIT trace execution | 2.55 μs | 12.9% |
+
+JIT traces do not always unwind cleanly, so 12.9% is only a lower bound. Even
so, interpreter dispatch remained high enough to suggest that some
high-frequency paths might not be running consistently as machine code.
+
+More traces would not necessarily be better. Initialization code does not need
to be compiled, and trace costs vary widely. Compilation results are worth
investigating only when the CPU is saturated, the path is hot, and interpreter
dispatch is unusually active.
+
+### 4.2 What `jit.v` Revealed—and Why We Misread It
+
+With `jit.v` enabled, one short load test reported 417 successful trace
compilations and 493 aborts. After aggregation by source location, a group of
paths each stopped at exactly 11 aborts.
+
+These are compilation-event counts—not unique functions, coverage, or CPU
time. `jit.v` also has several important limitations:
+
+- An abort line shows the trace abort location, while the penalty is applied
to the trace starting point; the two may not be the same line.
+- A function never appearing as a trace starting point does not mean it was
never compiled. Its body may have been inlined into a parent trace.
+- Text logs make it hard to reliably diff results between enabled and disabled
runs.
+
+At first, we read “0 appearances as a starting point” as “the whole function
runs in the interpreter.” The bytecode mode of `jit.dump` proved otherwise:
several function entries never became root traces, but their bodies repeatedly
entered other traces. The recurring failures were in phase-entry and
orchestration functions.
+
+> The absence of a trace starting point proves only that the location did not
become a root-trace anchor. It does not prove that the entire function never
entered machine code.
+
+### 4.3 Correlate `start`, `stop`, and `abort` by Trace Start
+
+To learn what failed to compile and why, we needed the event stream from
LuaJIT itself. We stored each `start` location by trace ID, then mapped the
matching `stop` or `abort` back to that same starting point:
+
+```lua
+-- Simplified illustration; actual callback arguments and parsing are more
complex
+local trace_start = {}
+
+jit.attach(function(what, trace_id, func, pc, err_code)
+ if what == "start" then
+ trace_start[trace_id] = locate(func, pc)
+ elseif what == "stop" then
+ record_compiled(trace_start[trace_id])
+ trace_start[trace_id] = nil
+ elseif what == "abort" then
+ record_abort(trace_start[trace_id], err_code)
+ trace_start[trace_id] = nil
+ end
+end, "trace")
+```
+
+The real probe also needs `jit.util.funcinfo` to resolve source locations and
`jit.vmdef.traceerr` to recover abort reasons. With that data, we can compare
the component's enabled and disabled states: which starting points compile,
which repeatedly abort, and whether a trace flush occurs.
+
+In the LuaJIT build used here, the failure penalty started at 72 and doubled
after each failure. It was 36,864 on the 10th failure and reached 73,728 on the
11th, above the 60,000 limit. Several starting points stopped at exactly 11
aborts and never entered the compiled set. No trace flush occurred during
collection, and the number of live traces in both test variants remained below
the cache limit, ruling out trace-cache exhaustion. Together, the evidence
showed that LuaJIT had abandone [...]
+
+That still does not mean LuaJIT abandoned those functions entirely. Other
parts could have been inlined into different traces.
+
+When the data was grouped by caller, every affected phase-entry and
orchestration function passed through the same custom logging bypass. Even when
the log level was too low to emit output, this path still inspected the request
phase, call stack, and request context. The added call did not appear as an
obvious hotspot. Instead, it changed the JIT outcome of its callers, making
part of the cost appear at function entry in ordinary request-processing
functions.
+
+```lua
+-- Simplified custom extension, not an APISIX OSS implementation
+if log_level_is_suppressed then
+ check_debug_capture(...)
+ check_request_buffer(...)
+ return
+end
+```
+
+The JIT data exposed costs the flame graph could not attribute cleanly and
confirmed that toggling the feature changed how hot paths executed. It still
could not quantify the throughput loss. The relevant fix was not to force every
function to compile, but to skip the unnecessary work entirely when the feature
was disabled.
+
+Probe placement also mattered. A module can capture a function reference
during `require`; replacing that function later leaves the captured reference
untouched. Our late probe saw 1 call per request. Moving it before
`require("apisix")` exposed the real rate: 5 calls per request.
+
+## 5. Use Paired A/B Tests to Measure the Impact
+
+The flame graph identified candidate locations, the call stacks showed why
paths executed repeatedly, and the LuaJIT events explained why some CPU samples
could not be attributed cleanly or were not visible in the flame graph. We
still needed paired A/B tests to measure the throughput impact.
+
+For the Global Rule path, we kept the same dispatch and configuration but made
the Prometheus handler return immediately at function entry. This helped
distinguish the cost of the plugin's processing logic from that of the shared
path before plugin entry. To avoid presenting absolute RPS from a customized
environment as an APISIX OSS benchmark, we normalized throughput with
Prometheus disabled to 100:
+
+| Internal A/B scenario | Relative throughput index | Relative to Prometheus
disabled |
+|---|---:|---:|
+| Prometheus disabled | 100.0 | Baseline |
+| Plugin and dispatch retained; Prometheus handler returns at entry | 77.2 |
-22.8% |
+| Complete Prometheus Global Rule | 56.9 | -43.1% |
+
+The gap remained even after short-circuiting the Prometheus processing code.
The experiment did not identify a single expensive line, but it showed that
metric calculation was not the only source of overhead. Together with the 9
filtering passes per request, the call stacks, and the C-level cost
distribution, this result showed that repeated filtering and the shared
pre-plugin path contributed materially to the throughput drop.
+
+We used the same method for the custom observability component. With workload
and configuration held constant, we collected compilation events, per-request
call counts, throughput, and response correctness with the component on and
off. JIT events explained why the feature did not appear as a single obvious
hotspot in the flame graph; the end-to-end A/B test measured its effect on
normalized throughput in this customized environment.
+
+The investigation can be summarized in five steps:
+
+| Step | Core question | Evidence |
+|---|---|---|
+| 1. Verify the worker is CPU-bound | Can the flame graph explain this
regression? | Worker saturation, CPU pinning, upstream, network, and
load-generator headroom, and stable reproduction |
+| 2. Compare widths | Where do samples accumulate? | Global flame graph and
candidate ranking |
+| 3. Follow stacks | What multiplies a small local cost? | Request phases,
shared functions, and per-request call counts |
+| 4. Inspect LuaJIT | Why are some CPU samples misattributed or absent from
the flame graph? | `start`, `stop`, `abort`, `flush`, and `jit.dump` |
+| 5. Run paired A/B tests | How large is the effect, and is it causal? |
Throughput, latency, call counts, error rate, and response consistency |
+
+A few limits on what this shows:
+
+- Flame-graph width, Lua self time, and throughput changes use different
denominators and cannot be directly subtracted or divided.
+- The custom observability component is not part of APISIX OSS. It is included
only to illustrate a general issue that custom extensions may encounter.
+- The values 29.6%, 12.9%, 417, 493, and abort ×11 apply only to this build
and collection window and must not be extrapolated.
+- “Did not become a trace starting point” does not mean “the function was not
compiled.” You must check whether the function body entered other traces.
+- JIT compilation results are diagnostic signals, not final performance
metrics. Any optimization must still be validated against throughput, latency,
error rate, response content, and GC behavior.
+
+The flame graph was not wrong. Width showed where CPU samples accumulated, and
call stacks showed how shared paths amplified the cost. But when that cost was
attributed to interpreter symbols, JIT traces, the allocator, or caller
functions, the graph no longer tied all of it back to the code that caused it.
+
+When that happens, collect LuaJIT compilation events, count calls per request,
and use paired A/B tests to measure the path's effect on normalized throughput
in the same environment rather than infer the cause from individual Lua lines.
In this investigation, the evidence pointed to eliminating unnecessary repeated
work rather than simply optimizing the widest flame-graph path.
+
+## References
+
+1. [WPS with Apache APISIX to create new API gateway
experience](https://apisix.apache.org/blog/2021/09/28/wps-usercase/)
+2. [1s to 10ms: Reducing Prometheus Delay in API
Gateway](https://api7.ai/blog/1s-to-10ms-reducing-prometheus-delay-in-api-gateway)
+3. [How Is Apache APISIX
Fast?](https://apisix.apache.org/blog/2023/06/12/how-is-apisix-fast/)
+4. [Apache APISIX Benchmark
Documentation](https://apisix.apache.org/docs/apisix/benchmark/)
diff --git a/blog/zh/blog/2026/08/28/debugging-apisix-throughput-regression.md
b/blog/zh/blog/2026/08/28/debugging-apisix-throughput-regression.md
new file mode 100644
index 00000000000..51e4d1fe310
--- /dev/null
+++ b/blog/zh/blog/2026/08/28/debugging-apisix-throughput-regression.md
@@ -0,0 +1,234 @@
+---
+title: "火焰图没撒谎,却没直接指出瓶颈:一次 APISIX 吞吐回退排查"
+authors:
+ - name: "Xin Rong"
+ title: "Author"
+ url: "https://github.com/AlinsRan";
+ image_url: "https://github.com/AlinsRan.png";
+ - name: "Yilia Lin"
+ title: "Technical Writer"
+ url: "https://github.com/Yilialinn";
+ image_url: "https://github.com/Yilialinn.png";
+keywords:
+ - Apache APISIX
+ - 火焰图
+ - LuaJIT
+ - 性能优化
+ - 吞吐回退
+description: "一次 APISIX 吞吐回退排查中,火焰图中最宽的热点无法解释全部回退。本文结合 CPU 采样、调用栈、LuaJIT
编译事件、每请求调用次数和配对 A/B 实验,说明如何识别被公共路径放大、却容易被热点排序忽略的性能成本。"
+tags: [Ecosystem]
+---
+
+一次 APISIX 吞吐回退中,火焰图最宽的路径无法解释全部回退。另有两条值得追查的路径,其 Lua self time 在带 Lua
上下文的样本中分别只占 3.0% 和 3.9%。
+
+<!--truncate-->
+
+按热点大小排序,这两个位置根本进不了第一轮优化名单。
+
+这次排查按以下顺序展开:先确认 CPU
确实是瓶颈,再根据火焰图宽度圈定候选位置;然后沿调用栈追查重复调用和公共路径如何放大成本;如果火焰图无法解释端到端差距,就继续检查 LuaJIT
编译与中断事件;最后通过每请求调用次数和配对 A/B 实验量化实际影响。
+
+> 数据范围:下文数据来自同一受控环境中的一个 APISIX 内部定制构建,其中加载了 100
余个插件。文中的吞吐数据均经过归一化,只用于说明定位过程和判断依据,不代表 Apache APISIX OSS 在其他硬件、配置或负载下的通用表现。
+
+## 1. 先确认瓶颈是否在 CPU
+
+火焰图显示的是采样期间 CPU 在执行什么。只有目标 worker 的 CPU 接近饱和、吞吐受这个核限制时,才能用火焰图的宽度解释这次性能回退。
+
+我们在采样前固定了这些条件:
+
+- APISIX 单 worker 并绑定独占物理核;
+- 上游服务和压测端使用其他核,避免 CPU 争抢;
+- 请求模型、配置、响应内容保持一致;
+- 吞吐回退可稳定复现,错误率稳定,响应结果一致;
+- 目标 worker 持续接近饱和,上游、网络、压测端仍有余量。
+
+如果不满足这些前提,首先应该查连接、网络、上游或压测端,而不是在 on-CPU 火焰图里找答案。
+
+## 2. 根据宽度筛选候选
+
+我们使用 eBPF 以 500 Hz 同时采集 C 和 Lua 调用栈。下面是排查中的真实 Lua on-CPU 火焰图。
+
+
+
+*图 1:Lua on-CPU 火焰图全局视图。搜索 `run_global_rules` 命中 3 处,但在整张图中并不醒目。原始采样共 2,446
个样本;截图已移除进程 PID。*
+
+火焰图的 x 轴没有先后关系,真正有意义的是宽度:路径越宽,落在其中的样本越多。按 Lua self time 排序后,初步候选位置如下:
+
+| 候选位置 | Lua self time | 初判 |
+|---|---:|---|
+| Prometheus exporter | 25.9% | 最值得先看 |
+| `ctx.var` 元方法 | 15.1% | 第二候选 |
+| 自定义日志旁路 | 3.9% | 很容易被忽略 |
+| `run_global_rules` | 3.0% | 很容易被忽略 |
+
+这里的 self time 是指在带 Lua 上下文的样本中,直接落在这个位置上的比例,而不是总 CPU 占比。本次采样约有 19.6% 的样本缺失 Lua
上下文,所以这些百分比只用于筛选候选,不能直接预测吞吐收益。
+
+这个排名有四个盲区:
+
+1. LuaJIT 解释执行时,不同的 Lua 代码可能折叠到共享的 `lj_BC_*`、`lj_vm_*` 符号里。
+2. 已编译的 JIT trace 不一定能被常规栈回溯完整展开,因此可观察到的 JIT 样本只是下界。
+3. 表查找、内存分配、GC 等成本会记在 C 符号上,而不是触发的 Lua 行上。
+4. 一个调用可能改变调用方的 JIT 状态,使成本看起来落在调用方函数的头上。
+
+`run_global_rules` 还有一个特征:它没有形成单个显著热点,而是散在多个请求阶段的调用栈里。单个位置都不宽,但累计成本可能并不低。
+
+## 3. 沿调用栈追查:3.0% 的 Lua self time 如何被放大
+
+选中某个 `run_global_rules` 方块并沿调用栈向上追踪,可以看到底部的请求阶段入口,以及后续的 `common_phase`、Global
Rule 插件筛选、调度和具体插件执行。
+
+
+
+*图 2:选中一条 `run_global_rules` 调用栈后的放大视图。所选栈会被重新铺满画布,因此宽度已经归一化,不能视为其占总 CPU
的比例。点击图片可查看大图。*
+
+调用栈的高度本身不代表耗时。沿栈展开可以看清成本从哪里进入、由谁调用,以及为什么会反复出现。
+
+修复前,`run_global_rules()` 会在请求的多个阶段调用 `_M.filter()`。`_M.filter()`
遍历所有已加载插件,再逐个判断该插件是否被 Global Rule 配置:
+
+```lua
+-- 简化示意,非 APISIX 完整实现
+for _, plugin_obj in ipairs(local_plugins) do
+ local name = plugin_obj.name
+ local plugin_conf = user_plugin_conf[name]
+ if type(plugin_conf) ~= "table" then
+ goto continue
+ end
+ -- 处理已配置插件
+ ::continue::
+end
+```
+
+这段逻辑通过两个因素放大了成本:
+
+1. 单次过滤的成本随已加载插件数量增长。
+2. 相同过滤结果跨请求阶段重复生成;`body_filter` 与 `delayed_body_filter` 还可能按响应块多次进入。
+
+本次测试配置中,一个请求实际触发了 **9 次过滤**。也就是说,同一个请求把“从 100 多个插件中找出已配置插件”这项工作重复做了 9 次。
+
+这也解释了为什么 Lua 层 3.0% 会低估整条路径成本:
+
+| 实际工作 | 火焰图常见归属 |
+|---|---|
+| 循环本身 | `plugin.lua` 对应位置 |
+| 大量表查找 | `lj_BC_TGETS` |
+| 临时表分配 | `lj_alloc_malloc` |
+| 临时对象回收 | `gc_sweep` |
+| 未编译解释器派发 | `lj_vm_*` / `lj_BC_*` |
+
+虽然 self time 只有 3%,但调用栈表明它位于一条会被反复进入的公共路径。对应的优化方式是:同一请求内,只要 Global Rule
和匹配路由没有变化,就复用已筛选的插件集合,而不是在每个阶段重新生成。
+
+## 4. 火焰图解释不了差距时,查 LuaJIT 编译事件
+
+第二条路径来自自定义观测组件。它和日志旁路不属于 APISIX OSS,但揭示的问题对 APISIX 插件和 OpenResty
扩展有参考价值:一次看似开销不大的调用,不仅会产生直接成本,还可能改变调用方后续代码的执行方式,使其由解释器执行或以机器码运行。
+
+### 4.1 解释器派发异常活跃
+
+把 C 层样本按运行时类型重新分类后,最明显的信号来自解释器执行与 JIT 执行的比例:
+
+| 运行类别 | 每请求 CPU 时间 | 占本次样本 |
+|---|---:|---:|
+| 解释器派发:`lj_BC_*` / `lj_vm_*` | 5.86 μs | 29.6% |
+| 可观察到的 JIT trace 执行 | 2.55 μs | 12.9% |
+
+JIT trace 的调用栈不一定能完整 unwind,因此 12.9%
只能视为下界。即便如此,同一环境中的解释器派发占比仍然很高,说明某些高频路径可能没有稳定运行在机器码中。
+
+trace 数量并非越多越好。初始化代码不需要追求编译,不同 trace 的成本差异也很大。只有在 CPU
饱和、路径高频、解释器派发异常时,编译结果才值得深入检查。
+
+### 4.2 `jit.v` 暴露异常,也导致了第一次误判
+
+开启 `jit.v` 后,一次短时压测记录了 417 次 trace 编译成功和 493 次 abort。按位置聚合后,一批路径的 abort 次数都停在
11。
+
+但这些数字是编译事件次数,不是去重后的函数个数、覆盖率或 CPU 时间。使用 `jit.v` 时还要注意:
+
+- abort 行显示的是 trace 中断位置,而惩罚记在 trace 起点,两者可能不是同一行。
+- 某函数从未成为 trace 起点,不代表它没有被编译,函数体可能已被内联进父 trace。
+- 仅凭文本日志,很难稳定比较功能开启和关闭两组结果的差异。
+
+我们一开始把“起点出现次数为 0”误读成“整个函数都在解释执行”。后来用 `jit.dump` 字节码模式复核后发现,多个函数入口虽然没有成为 root
trace,但函数体已多次进入其他 trace。真正反复失败的是阶段入口和编排函数。
+
+> 看不到 trace 起点,只能证明这里没有成为 root trace 锚点;不能证明整个函数没有进入机器码。
+
+### 4.3 按 trace 起点关联 `start`、`stop` 和 `abort`
+
+要确认哪段代码没有编译以及原因,需要直接采集 LuaJIT 的事件流。具体做法是按 trace id 保存 `start` 的位置,再把后续 `stop`
或 `abort` 关联到同一个起点:
+
+```lua
+-- 简化示意,实际回调参数和解析逻辑更复杂
+local trace_start = {}
+
+jit.attach(function(what, trace_id, func, pc, err_code)
+ if what == "start" then
+ trace_start[trace_id] = locate(func, pc)
+ elseif what == "stop" then
+ record_compiled(trace_start[trace_id])
+ trace_start[trace_id] = nil
+ elseif what == "abort" then
+ record_abort(trace_start[trace_id], err_code)
+ trace_start[trace_id] = nil
+ end
+end, "trace")
+```
+
+实际探针还要用 `jit.util.funcinfo` 解析源位置,用 `jit.vmdef.traceerr` 还原 abort
原因。这样就能比较自定义组件开启和关闭时的差异:哪些起点进入 compiled 集合,哪些反复 abort,以及是否发生 trace flush。
+
+在本次 LuaJIT 构建中,失败惩罚从 72 开始逐次翻倍:第 10 次是 36,864,第 11 次达到 73,728,超过 60,000
上限。多个起点的 abort 次数恰好停在 11 次,之后不再增加,也没有进入 compiled 集合;采集期间未发生 trace flush。两组存活
trace 数均低于缓存上限,因此可以排除 trace 缓存被挤爆的可能。这些证据说明,LuaJIT 已经放弃继续编译这些 trace 起点。
+
+这并不意味着整个函数体都被放弃;函数的其他部分仍可能被内联进别的 trace。
+
+按调用来源聚合后,受影响的阶段入口和编排函数都经过同一条自定义日志旁路。即使日志级别不足、不产生输出,这条路径仍会检查请求阶段、调用栈和请求上下文。新增调用本身没有形成显著热点,但它改变了调用方的
JIT 结果,使部分成本看起来落在正常请求处理函数的入口处。
+
+```lua
+-- 自定义扩展的简化示意,不是 APISIX OSS 实现
+if log_level_is_suppressed then
+ check_debug_capture(...)
+ check_request_buffer(...)
+ return
+end
+```
+
+JIT
数据既能发现火焰图无法正确归属的成本,也能验证功能开关确实改变了高频路径的执行状态。但这些数据不能直接量化吞吐损失;优化目标也不是“强迫所有函数编译”,而是在功能关闭时彻底跳过本不该发生的工作。
+
+探针的安装时机也会影响结论。探针必须装在被观测模块加载之前;如果模块在 `require`
时保存了函数引用,之后替换原函数,计数器只能看到少量仍然经过替换后函数的调用。本次探针注入较晚时测到 1 次/请求;把它前移到
`require("apisix")` 之前,才确认真实值是 5 次/请求。
+
+## 5. 用配对 A/B 实验量化吞吐影响
+
+火焰图用于定位可疑路径,调用栈揭示成本如何被放大,LuaJIT 事件解释部分 CPU 样本为何无法准确归属或未出现在火焰图中。最终还需要通过配对 A/B
实验量化这些路径对吞吐的影响。
+
+以 Global Rule 路径为例,我们保留相同的调度和配置,只让 Prometheus
处理函数在入口处立即返回,用来区分“插件处理逻辑慢”和“进入插件前的公共路径慢”。为避免把定制环境的绝对 RPS 当成 APISIX OSS
benchmark,我们把关闭 Prometheus 时的吞吐归一化为 100:
+
+| 内部 A/B 场景 | 相对吞吐指数 | 相对关闭 Prometheus |
+|---|---:|---:|
+| 关闭 Prometheus | 100.0 | 基准 |
+| 保留插件与调度,Prometheus 处理函数在入口处返回 | 77.2 | -22.8% |
+| 完整 Prometheus Global Rule | 56.9 | -43.1% |
+
+即使 Prometheus
处理代码被短路,差距仍然显著。这个实验不能把成本定位到某一行,但足以证明损耗不只来自指标计算,进入插件前的公共路径本身就值得追查。结合每请求 9
次过滤、调用栈和 C 层成本分布,可以判断重复过滤和插件执行前的公共路径是吞吐回退的重要影响因素。
+
+自定义观测组件也采用同样的方法:保持负载和配置不变,分别在开启和关闭组件时采集编译事件、每请求调用次数、吞吐和响应正确性。JIT
事件用于解释为什么该功能没有在火焰图中表现为单个显著热点,端到端 A/B 实验则用于量化这条路径在本次定制环境中对归一化吞吐的影响。
+
+整个排查过程可以归纳为五步:
+
+| 步骤 | 核心问题 | 证据 |
+|---|---|---|
+| 1. 确认 CPU 前提 | 火焰图能否解释这次回退? | worker 饱和、绑核、上下游余量、稳定复现 |
+| 2. 根据宽度筛选候选 | 样本主要落在哪些路径? | 全局火焰图与候选排序 |
+| 3. 沿调用栈追查 | 小成本为什么会被放大? | 调用阶段、公共函数、每请求调用次数 |
+| 4. 检查 LuaJIT | 部分 CPU 样本为何无法准确归属或未出现在火焰图中? | `start`、`stop`、`abort`、`flush`
与 `jit.dump` |
+| 5. 用配对 A/B 量化 | 实际影响有多大,因果关系是否成立? | 吞吐、延迟、调用次数、错误率与响应一致性 |
+
+使用这些结论时还需注意以下限制:
+
+- 火焰图宽度、Lua self time 与吞吐变化的分母不同,不能直接相减或相除。
+- 自定义观测组件不属于 APISIX OSS,只用于说明自定义扩展可能遇到的通用问题。
+- 29.6%、12.9%、417、493 和 abort ×11 仅适用于本次构建和采集窗口,不能外推。
+- “没有成为 trace 起点”不等于“函数没有编译”,必须检查函数体是否进入其他 trace。
+- JIT 编译结果是定位信号,不是最终性能指标;优化后仍需验证吞吐、延迟、错误率、响应内容和 GC 行为。
+
+火焰图的宽度能显示 CPU 样本的聚集位置,调用栈能显示公共路径如何放大成本。但当成本被记到解释器符号、JIT
trace、内存分配器或调用方函数的入口处时,火焰图就无法把所有成本都对应到真正触发它们的代码。
+
+遇到这种情况,应直接采集 LuaJIT 编译事件,再结合每请求调用次数和配对 A/B 实验,量化这条路径在同一环境中对归一化吞吐的影响,而不是仅凭单行
Lua 代码推断原因。本次排查的证据表明,应优先消除不必要的重复工作,而不是只处理火焰图中最宽的路径。
+
+## 参考资料
+
+1. [WPS with Apache APISIX:火焰图与 LuaJIT
性能实践](https://apisix.apache.org/blog/2021/09/28/wps-usercase/)
+2. [1s to 10ms:Prometheus
长尾延迟的复现、定位与修复](https://api7.ai/blog/1s-to-10ms-reducing-prometheus-delay-in-api-gateway)
+3. [How Is Apache APISIX
Fast?](https://apisix.apache.org/blog/2023/06/12/how-is-apisix-fast/)
+4. [Apache APISIX Benchmark
文档](https://apisix.apache.org/docs/apisix/benchmark/)




