zhendongcmss opened a new issue #5146:
URL: https://github.com/apache/apisix/issues/5146
### Issue description
**Description**
In the Cluster, we foud `apisix_http_latency_count` is negative sometimes.
we add `code `and `method ` value on the metrices.latency based on community
code. I’m not sure if it’s caused by this. I search "latency" on the issues
list and didn't find userful message.
**Our code:apisix/plugins/prometheus/exporter.lua**
```lua line:105
metrics.latency = prometheus:histogram("http_latency",
"HTTP request latency in milliseconds per service in APISIX",
{"type","code", "method", "route", "service", "consumer", "node"},
DEFAULT_BUCKETS)
...
local latency = (ngx.now() - ngx.req.start_time()) * 1000
metrics.latency:observe(latency,
gen_arr("request", vars.status, method_id, route_id, service_id,
consumer_name, balancer_ip))
local apisix_latency = latency
if ctx.var.upstream_response_time then
local upstream_latency = ctx.var.upstream_response_time * 1000
metrics.latency:observe(upstream_latency,
gen_arr("upstream", vars.status, method_id, route_id,
service_id, consumer_name, balancer_ip))
apisix_latency = apisix_latency - upstream_latency
end
metrics.latency:observe(apisix_latency,
gen_arr("apisix", vars.status, method_id, route_id, service_id,
consumer_name, balancer_ip))
code file:
https://gist.github.com/zhendongcmss/994e1a667f8892e844e6531be5cfac2b
```
**curl http://127.0.0.1:29091/apisix/prometheus/metrics | grep 404**
```
apisix_http_latency_bucket{type="upstream",code="404",method="GET",route="11",service="",consumer="",node="10.195.152.61",le="+Inf"}
1
apisix_http_latency_count{type="apisix",code="404",method="GET",route="11",service="",consumer="",node="10.195.152.61"}
1
apisix_http_latency_count{type="request",code="404",method="GET",route="11",service="",consumer="",node="10.195.152.61"}
1
apisix_http_latency_count{type="upstream",code="404",method="GET",route="11",service="",consumer="",node="10.195.152.61"}
1
apisix_http_latency_sum{type="apisix",code="404",method="GET",route="11",service="",consumer="",node="10.195.152.61"}
-1.0000114440918
apisix_http_latency_sum{type="request",code="404",method="GET",route="11",service="",consumer="",node="10.195.152.61"}
111.99998855591
apisix_http_latency_sum{type="upstream",code="404",method="GET",route="11",service="",consumer="",node="10.195.152.61"}
113
```
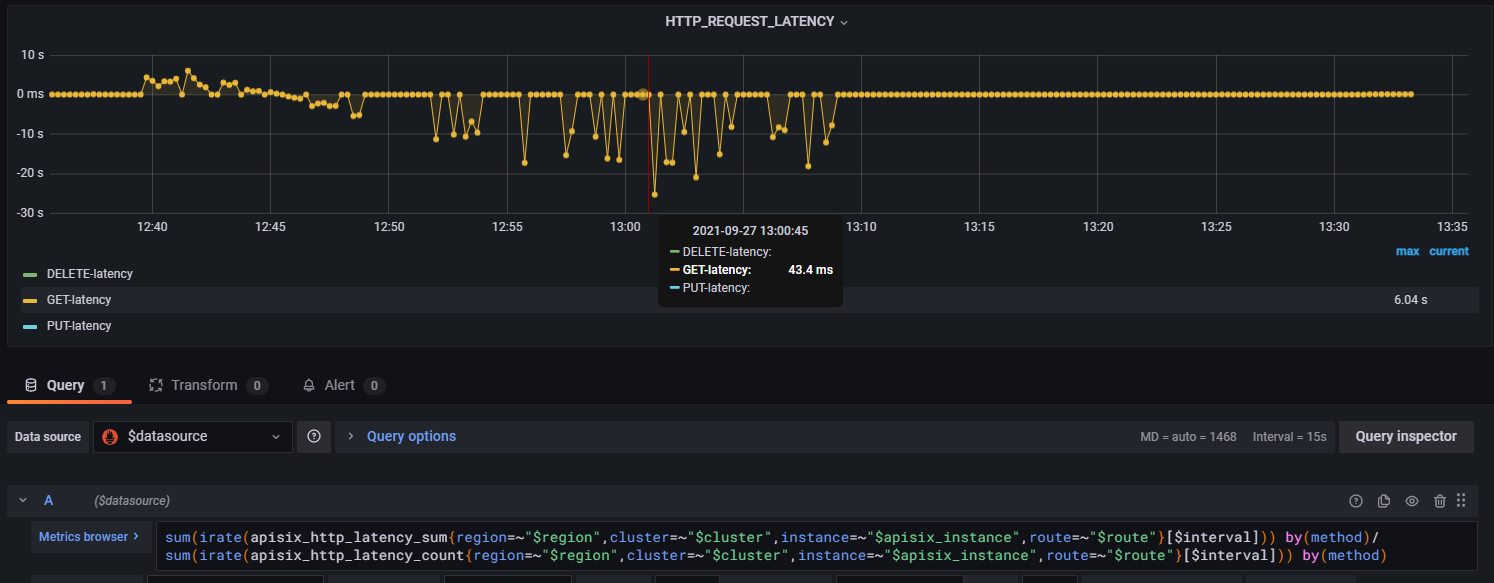
**Grafana dashboard**
### Environment
- apisix version (cmd: `apisix version`): 2.7
- OS (cmd: `uname -a`): Linux ZJNB-ICLOUD-SPOD2-PM-DC01-ACCESSER-01
4.19.25-200.el7.bclinux.x86_64 SMP Wed May 29 00:02:44 CST 2019 x86_64 x86_64
x86_64 GNU/Linux (based centos 7.6)
- OpenResty / Nginx version (cmd: `nginx -V` or `openresty -V`):
```
nginx version: openresty/1.19.3.2
built by gcc 9.3.1 20200408 (Red Hat 9.3.1-2) (GCC)
built with OpenSSL 1.1.1k 25 Mar 2021 (running with OpenSSL 1.1.1h 22 Sep
2020)
TLS SNI support enabled
configure arguments: --prefix=/usr/local/openresty/nginx --with-cc-opt='-O2
-DNGX_LUA_ABORT_AT_PANIC -I/usr/local/openresty/zlib/include
-I/usr/local/openresty/pcre/include -I/usr/local/openresty/openssl111/include'
--add-module=../ngx_devel_kit-0.3.1 --add-module=../echo-nginx-module-0.62
--add-module=../xss-nginx-module-0.06 --add-module=../ngx_coolkit-0.2
--add-module=../set-misc-nginx-module-0.32
--add-module=../form-input-nginx-module-0.12
--add-module=../encrypted-session-nginx-module-0.08
--add-module=../srcache-nginx-module-0.32 --add-module=../ngx_lua-0.10.19
--add-module=../ngx_lua_upstream-0.07
--add-module=../headers-more-nginx-module-0.33
--add-module=../array-var-nginx-module-0.05
--add-module=../memc-nginx-module-0.19 --add-module=../redis2-nginx-module-0.15
--add-module=../redis-nginx-module-0.3.7 --add-module=../ngx_stream_lua-0.0.9
--with-ld-opt='-Wl,-rpath,/usr/local/openresty/luajit/lib
-L/usr/local/openresty/zlib/lib -L/usr/local/openresty/pcre/lib -L/usr/loca
l/openresty/openssl111/lib
-Wl,-rpath,/usr/local/openresty/zlib/lib:/usr/local/openresty/pcre/lib:/usr/local/openresty/openssl111/lib'
--with-cc='ccache gcc -fdiagnostics-color=always' --with-pcre-jit
--with-stream --with-stream_ssl_module --with-stream_ssl_preread_module
--with-http_v2_module --without-mail_pop3_module --without-mail_imap_module
--without-mail_smtp_module --with-http_stub_status_module
--with-http_realip_module --with-http_addition_module
--with-http_auth_request_module --with-http_secure_link_module
--with-http_random_index_module --with-http_gzip_static_module
--with-http_sub_module --with-http_dav_module --with-http_flv_module
--with-http_mp4_module --with-http_gunzip_module --with-threads --with-compat
--with-stream --with-http_ssl_module
```
- etcd version, if have (cmd: run `curl
http://127.0.0.1:9090/v1/server_info` to get the info from server-info API):
- apisix-dashboard version, if have:
- the plugin runner version, if the issue is about a plugin runner (cmd:
depended on the kind of runner):
- luarocks version, if the issue is about installation (cmd: `luarocks
--version`):
### Steps to reproduce
1. Config global rules
```
{
"node":{
"dir":true,
"nodes":[
{
"createdIndex":1280,
"value":{
"id":"1",
"update_time":1632448084,
"plugins":{
"prometheus":{
"prefer_name":false
},
"request-id":{
"header_name":"x-request-id",
"include_in_response":true
},
"limit-conn":{
"conn":1000000,
"key":"constant",
"burst":0,
"rejected_code":503,
"default_conn_delay":0.1
},
"http-logger":{
"use_tcp_transmission":true,
"concat_method":"new_line",
"send_prometheus_data":false,
"batch_max_size":1,
"auth_header":"",
"include_req_body":false,
"max_retry_count":0,
"name":"http logger",
"timeout":3,
"retry_delay":1,
"buffer_duration":60,
"inactive_timeout":5,
"uri":"http://10.195.152.61:15151";
}
},
"create_time":1630833580
},
"key":"/apisix-ZJNB-ICLOUD-SPOD2-PM-DC01-ACCESSER-01/global_rules/1",
"modifiedIndex":491489
}
],
"key":"/apisix-ZJNB-ICLOUD-SPOD2-PM-DC01-ACCESSER-01/global_rules"
},
"count":"2",
"action":"get"
}
2. Use the modified expolter.lua
https://gist.github.com/zhendongcmss/994e1a667f8892e844e6531be5cfac2b
```
### Actual result
No call stack
### Error log
Don't find prometheus logs in access.log and error.log
### Expected result
_No response_
--
This is an automated message from the Apache Git Service.
To respond to the message, please log on to GitHub and use the
URL above to go to the specific comment.
To unsubscribe, e-mail: [email protected]
For queries about this service, please contact Infrastructure at:
[email protected]