tokers commented on issue #696:
URL:
https://github.com/apache/apisix-ingress-controller/issues/696#issuecomment-930097187
> > Not sure whether this is due to the inappropriate settings about the prom http handler. > > https://github.com/apache/apisix-ingress-controller/blob/master/pkg/api/router/router.go#L43 > > You may try to have a closer look about the use of prom http handler. > > I think I've found the reason. Since I noticed that the exist metrics are all exposed in `./pkg/apisix` and the leader consistent to be 0. It seems the `metricsCollector: metrics.NewPrometheusCollector(),` in `cluster.go` has _overwrite_ (or some else term to describe this condition) the same one in `controller.go`. So I currently annotate the `metricCollector` in `cluster.go` and those calling in `./pkg/apisix` > > ``` > c := &cluster{ > name: o.Name, > baseURL: o.BaseURL, > baseURLHost: u.Host, > ... > // metricsCollector: metrics.NewPrometheusCollector(), > } > ``` > > And keep this in `controller.go` and `./pkg/ingress` > > ``` > c := &Controller{ > name: podName, > namespace: podNamespace, > cfg: cfg, > apiServer: apiSrv, > apisix: client, > metricsCollector: metrics.NewPrometheusCollector(), > ... > } > ``` > > And some metrics like `events_total` have appeared in prometheus. A quickly preview in grafana of those missing metrics: 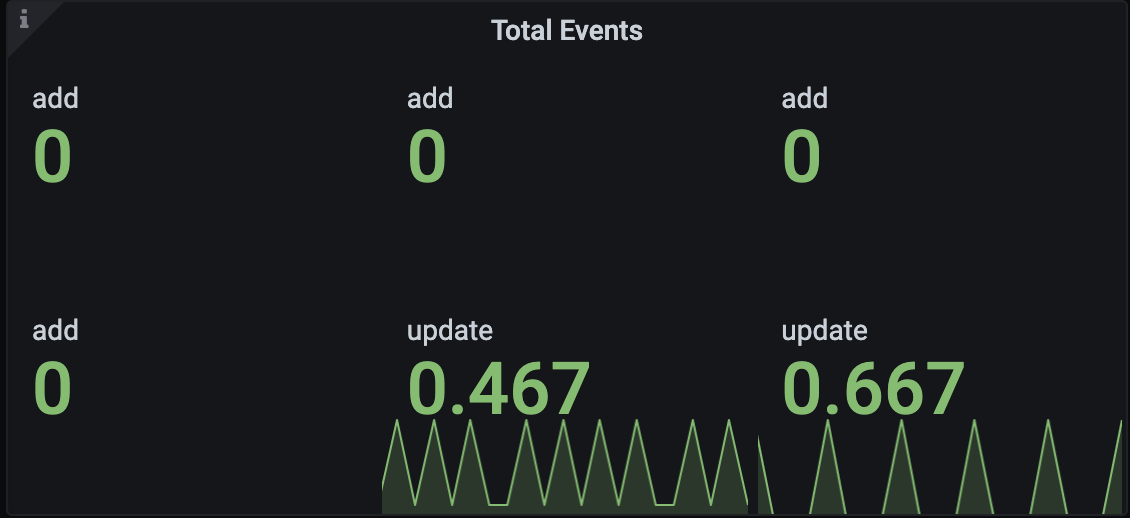 > > 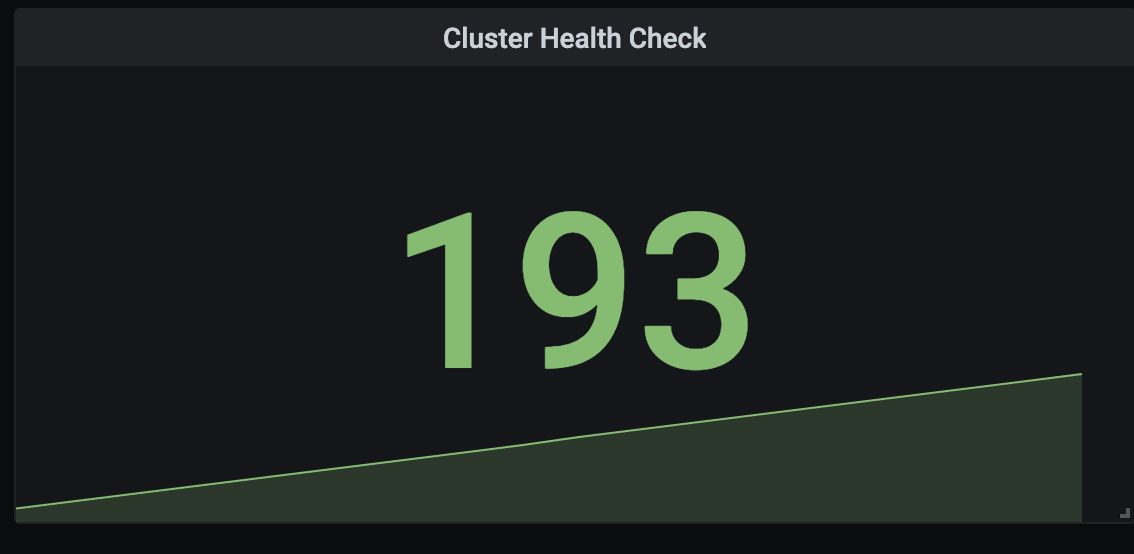 > > Could you please point out my mistakes in coding and the correct way to instantiate the `metricCollector` in both `./pkg/apisix/cluster.go` and `./pkg/ingress/controller.go`? You can just instantiate the metrics collector in the controller and just pass that one to cluster. -- This is an automated message from the Apache Git Service. To respond to the message, please log on to GitHub and use the URL above to go to the specific comment. To unsubscribe, e-mail: [email protected] For queries about this service, please contact Infrastructure at: [email protected]