This is an automated email from the ASF dual-hosted git repository.

bzp2010 pushed a commit to branch master
in repository https://gitbox.apache.org/repos/asf/apisix-website.git
The following commit(s) were added to refs/heads/master by this push:
new 86ae863 docs: add Monitor Ingress Controller with Prometheus blog
(#809)
86ae863 is described below
commit 86ae86305961546ac1ef6fe2de94fdfa3e2feea1
Author: Sylvia <[email protected]>
AuthorDate: Tue Dec 14 09:06:27 2021 +0800
docs: add Monitor Ingress Controller with Prometheus blog (#809)
---
...or-apisix-ingress-controller-with-prometheus.md | 186 +++++++++++++++++++
...or-apisix-ingress-controller-with-prometheus.md | 196 +++++++++++++++++++++
2 files changed, 382 insertions(+)
diff --git
a/website/blog/2021/12/13/monitor-apisix-ingress-controller-with-prometheus.md
b/website/blog/2021/12/13/monitor-apisix-ingress-controller-with-prometheus.md
new file mode 100644
index 0000000..8bf92ab
--- /dev/null
+++
b/website/blog/2021/12/13/monitor-apisix-ingress-controller-with-prometheus.md
@@ -0,0 +1,186 @@
+---
+title: "Monitoring APISIX Ingress Controller with Prometheus"
+authors:
+ - name: "Chao Zhang"
+ title: "Author"
+ url: "https://github.com/tokers";
+ image_url: "https://avatars.githubusercontent.com/u/10428333?v=4";
+ - name: "Sylvia"
+ title: "Technical Writer"
+ url: "https://github.com/SylviaBABY";
+ image_url: "https://avatars.githubusercontent.com/u/39793568?v=4";
+keywords:
+- Apache APISIX
+- APISIX Ingress Controller
+- Prometheus
+- Metrics
+- Grafana
+description: This article introduces the relevant steps of how to use
Prometheus to monitor APISIX Ingress Controller and the display effect of some
indicators.
+tags: [Technology]
+---
+
+> This article introduces the relevant steps of how to use Prometheus to
monitor APISIX Ingress Controller and the display effect of some indicators.
+
+<!--truncate-->
+
+Whether in the days of monolithic applications or today's cloud-native era,
"monitoring functions" have always played a very important role. A good
monitoring system can help engineers quickly understand the status of services
running in production environments, and quickly locate problems or warn of
anomalies when they occur.
+
+Apache APISIX Ingress Controller has been enhanced to support Prometheus
Metrics in recent releases. In this article, we will introduce how to use
Prometheus to collect Metrics data from APISIX Ingress Controller and
subsequently visualize it through Grafana.
+
+## Step 1: Install APISIX Ingress Controller
+
+First we deploy Apache APISIX, ETCD and APISIX Ingress Controller to the local
Kubernetes cluster via [Helm](https://helm.sh/).
+
+```shell
+helm repo add apisix https://charts.apiseven.com
+helm repo update
+kubectl create namespace ingress-apisix
+helm install apisix apisix/apisix --namespace ingress-apisix \
+ --set ingress-controller.enabled=true
+```
+
+After installation, please wait until all services are up and running.
Specific status confirmation can be checked with the following command.
+
+```shell
+kubectl get all -n ingress-apisix
+```
+
+## Step 2: Enable the Prometheus Plugin
+
+In most cases, the monitoring function must involve more than just the APISIX
Ingress Controller component. If you need to monitor Apache APISIX at the same
time, you can create the following `ApisixClusterConfig` resource.
+
+### Installing Prometheus and Grafana
+
+Next, we will enable the Prometheus service through the Prometheus Operator,
so you will need to install the Prometheus Operator first.
+
+:::note
+The following command will also install Grafana.
+:::
+
+```shell
+helm repo add prometheus-community
https://prometheus-community.github.io/helm-charts
+heml repo update
+kubectl create namespace prometheus
+helm install prometheus prometheus-community/kube-prometheus-stack -n
prometheus
+```
+
+After installation, you need to prepare the RBAC configuration for the
Prometheus instance. This configuration gives Prometheus the ability to obtain
Pod and Service resources from the Kubernetes API Server.
+
+```yaml
+apiVersion: v1
+kind: ServiceAccount
+metadata:
+ name: ingress-apisix
+ namespace: ingress-apisix
+---
+apiVersion: rbac.authorization.k8s.io/v1
+kind: ClusterRole
+metadata:
+ name: ingress-apisix
+rules:
+- apiGroups: [""]
+ resources:
+ - nodes
+ - nodes/metrics
+ - services
+ - endpoints
+ - pods
+ verbs: ["get", "list", "watch"]
+- apiGroups: [""]
+ resources:
+ - configmaps
+ verbs: ["get"]
+- apiGroups:
+ - networking.k8s.io
+ resources:
+ - ingresses
+ verbs: ["get", "list", "watch"]
+- nonResourceURLs: ["/metrics"]
+ verbs: ["get"]
+---
+apiVersion: rbac.authorization.k8s.io/v1
+kind: ClusterRoleBinding
+metadata:
+ name: ingress-apisix
+roleRef:
+ apiGroup: rbac.authorization.k8s.io
+ kind: ClusterRole
+ name: ingress-apisix
+subjects:
+- kind: ServiceAccount
+ name: ingress-apisix
+ namespace: ingress-apisix
+```
+
+After completing the above instance configuration, PodMonitor needs to be
defined, or you can choose to use ServiceMonior depending on the scenario
requirements. The following PodMonitor resources will focus on Metrics
collection for the APISIX Ingress Controller Pod.
+
+```yaml
+apiVersion: monitoring.coreos.com/v1
+kind: PodMonitor
+metadata:
+ name: ingress-apisix
+ namespace: ingress-apisix
+ labels:
+ use-for: ingress-apisix
+spec:
+ selector:
+ matchLabels:
+ app.kubernetes.io/name: ingress-controller
+ podMetricsEndpoints:
+ - port: http
+```
+
+:::note
+The reason for not using ServiceMonitor here is that the `http` port is not
exposed to the Service level.
+:::
+
+Finally, the Prometheus instance can be defined with the following command.
+
+```yaml
+apiVersion: monitoring.coreos.com/v1
+kind: Prometheus
+metadata:
+ name: ingress-apisix
+ namespace: ingress-apisix
+spec:
+ serviceAccountName: ingress-apisix
+ podMonitorSelector:
+ matchLabels:
+ use-for: ingress-apisix
+ resources:
+ requests:
+ memory: 400Mi
+ enableAdminAPI: false
+ image: prom/prometheus:v2.31.0
+```
+
+After applying all of the above resources to the Kubernetes cluster, wait for
the relevant components to be ready.
+
+## Step 3: Configuring Grafana
+
+Next, we configure Grafana for visual presentation.
+
+Start by accessing the `prometheus-grafana` service. Note that if you do not
have a means to expose the service to the outside of the cluster, you can try
using port forwarding. The Grafana administrator username and password are
stored in the `prometheus-grafana` Secret.
+
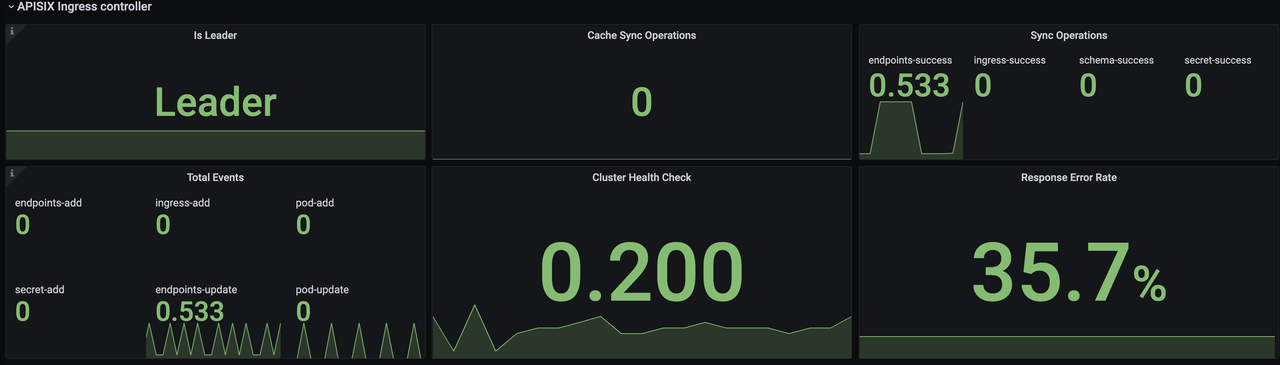
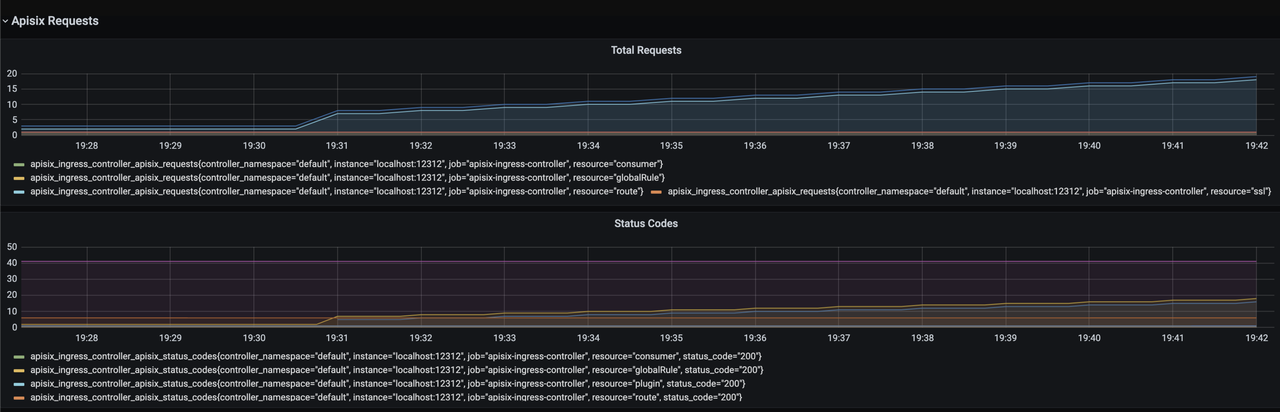
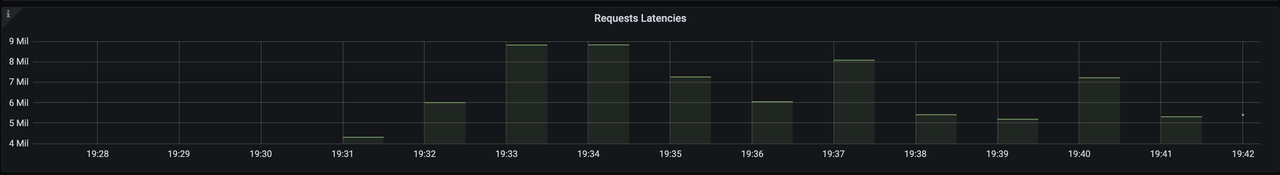
+After opening Grafana, import the [Dashboard
template](https://raw.githubusercontent.com/apache/apisix-ingress-controller/22e548bc267115ccd36aec4200d5399aab565958/docs/assets/other/json/apisix-ingress-controller-grafana.json)
of APISIX Ingress Controller to see the monitoring dashboard, which looks like
the following.
+
+
+
+
+
+
+
+For more information on creating Dashboard templates, please see [related
PR](https://github.com/apache/apisix-ingress-controller/pull/731).
+
+## Addendum: Monitoring Metrics Explained
+
+The current monitoring metrics for the APISIX Ingress Controller focus on its
interaction with the data plane Apache APISIX instances (configuration
delivery), including data related to the number and latency of configuration
synchronization.
+
+- `is_leader`: Whether the current APISIX Ingress Controller instance is in
the Leader role. The same group of APISIX Ingress Controllers will have only
one Leader, the rest of the instances are Candidate.
+- `sync_operations`: Includes some metrics when the APISIX Ingress Controller
synchronizes the configuration to the data plane, including the number of
pushes, failure rate, latency, etc. Through these metrics, you can monitor
whether the configuration delivery is normal or not, so as to help R&D and
operation and maintenance students to monitor and alert and locate faults.
+
+## Summary
+
+This article introduced how to use Prometheus to monitor APISIX Ingress
Controller and how to display some of the metrics. Currently, only some basic
monitoring metrics are included, we will continue to polish and upgrade, add
more metrics and integrate data surface APISIX metrics to bring you a better
monitoring experience.
+
+Of course, interested parties are welcome to contribute to the [Apache APISIX
Ingress Controller](https://github.com/apache/apisix-ingress-controller)
project, and we look forward to working together to make the APISIX Ingress
Controller more comprehensive.
diff --git
a/website/i18n/zh/docusaurus-plugin-content-blog/2021/12/13/monitor-apisix-ingress-controller-with-prometheus.md
b/website/i18n/zh/docusaurus-plugin-content-blog/2021/12/13/monitor-apisix-ingress-controller-with-prometheus.md
new file mode 100644
index 0000000..b6ef9c4
--- /dev/null
+++
b/website/i18n/zh/docusaurus-plugin-content-blog/2021/12/13/monitor-apisix-ingress-controller-with-prometheus.md
@@ -0,0 +1,196 @@
+---
+title: "使用 Prometheus 监控 APISIX Ingress Controller"
+authors:
+ - name: "张超"
+ title: "Author"
+ url: "https://github.com/tokers";
+ image_url: "https://avatars.githubusercontent.com/u/10428333?v=4";
+ - name: "苏钰"
+ title: "Technical Writer"
+ url: "https://github.com/SylviaBABY";
+ image_url: "https://avatars.githubusercontent.com/u/39793568?v=4";
+keywords:
+- Apache APISIX
+- APISIX Ingress Controller
+- Prometheus
+- Metrics
+- Grafana
+description: 本文介绍了如何使用 Prometheus 监控 APISIX Ingress Controller 的相关步骤和部分指标的展示效果。
+tags: [Technology]
+---
+
+> 本文介绍了如何使用 Prometheus 监控 APISIX Ingress Controller 的相关步骤和部分指标的展示效果。
+
+<!--truncate-->
+
+无论是之前单体应用的时代,或是云原生大行其道的今天,「监控功能」一直扮演着十分重要的角色。一个良好的监控体系能够帮助工程师们快速了解运行在生产环境中的服务状态,并在服务异常时快速定位问题或者提前预警异常的发生。
+
+Apache APISIX Ingress Controller 在最近几个版本中加强了对 Prometheus Metrics
的支持。本文将为大家介绍如何使用 Prometheus 收集 APISIX Ingress Controller 的 Metrics 数据,并通过
Grafana 进行后续可视化呈现。
+
+## 步骤一:安装 APISIX Ingress Controller
+
+首先我们通过 [Helm](https://helm.sh/) 将 Apache APISIX、ETCD 和 APISIX Ingress
Controller 部署到本地的 Kubernetes 集群中。
+
+```shell
+helm repo add apisix https://charts.apiseven.com
+helm repo update
+kubectl create namespace ingress-apisix
+helm install apisix apisix/apisix --namespace ingress-apisix \
+ --set ingress-controller.enabled=true
+```
+
+安装完毕后请等待,直至所有服务都已正常运行。具体状态确认可通过下述命令进行检查。
+
+```shell
+kubectl get all -n ingress-apisix
+```
+
+## 步骤二:启用 Prometheus 插件
+
+大部分情况下,监控功能的涉及面肯定不止 APISIX Ingress Controller 这一个组件,如果需要同时监控 Apache
APISIX,可以创建以下 `ApisixClusterConfig` 资源。
+
+```yaml
+apiVersion: apisix.apache.org/v2alpha1
+kind: ApisixClusterConfig
+metadata:
+ name: default
+spec:
+ monitoring:
+ prometheus:
+ enable: true
+```
+
+### 安装 Prometheus 和 Grafana
+
+接下来我们将通过 Prometheus Operator 来启用 Prometheus 服务,因此需要先安装 Prometheus Operator。
+
+:::note 注意
+下述命令同时也会安装 Grafana
+:::
+
+```shell
+helm repo add prometheus-community
https://prometheus-community.github.io/helm-charts
+heml repo update
+kubectl create namespace prometheus
+helm install prometheus prometheus-community/kube-prometheus-stack -n
prometheus
+```
+
+安装完毕后,需要准备 Prometheus 实例的 RBAC 配置。该配置可赋予 Prometheus 实例向 Kubernetes API Server
获取 Pod 和 Service 资源的能力。
+
+```yaml
+apiVersion: v1
+kind: ServiceAccount
+metadata:
+ name: ingress-apisix
+ namespace: ingress-apisix
+---
+apiVersion: rbac.authorization.k8s.io/v1
+kind: ClusterRole
+metadata:
+ name: ingress-apisix
+rules:
+- apiGroups: [""]
+ resources:
+ - nodes
+ - nodes/metrics
+ - services
+ - endpoints
+ - pods
+ verbs: ["get", "list", "watch"]
+- apiGroups: [""]
+ resources:
+ - configmaps
+ verbs: ["get"]
+- apiGroups:
+ - networking.k8s.io
+ resources:
+ - ingresses
+ verbs: ["get", "list", "watch"]
+- nonResourceURLs: ["/metrics"]
+ verbs: ["get"]
+---
+apiVersion: rbac.authorization.k8s.io/v1
+kind: ClusterRoleBinding
+metadata:
+ name: ingress-apisix
+roleRef:
+ apiGroup: rbac.authorization.k8s.io
+ kind: ClusterRole
+ name: ingress-apisix
+subjects:
+- kind: ServiceAccount
+ name: ingress-apisix
+ namespace: ingress-apisix
+```
+
+完成上述实例配置后,需要定义 PodMonitor,也可以根据场景需求选择使用 ServiceMonior。下述 PodMonitor 资源将聚焦于
APISIX Ingress Controller Pod 的 Metrics 收集。
+
+```yaml
+apiVersion: monitoring.coreos.com/v1
+kind: PodMonitor
+metadata:
+ name: ingress-apisix
+ namespace: ingress-apisix
+ labels:
+ use-for: ingress-apisix
+spec:
+ selector:
+ matchLabels:
+ app.kubernetes.io/name: ingress-controller
+ podMetricsEndpoints:
+ - port: http
+```
+
+:::note 额外说明
+这里不使用 ServiceMonitor 的原因是 `http` 这一端口没有暴露到 Service 级别。
+:::
+
+最后可通过下述指令进行 Prometheus 实例的定义。
+
+```yaml
+apiVersion: monitoring.coreos.com/v1
+kind: Prometheus
+metadata:
+ name: ingress-apisix
+ namespace: ingress-apisix
+spec:
+ serviceAccountName: ingress-apisix
+ podMonitorSelector:
+ matchLabels:
+ use-for: ingress-apisix
+ resources:
+ requests:
+ memory: 400Mi
+ enableAdminAPI: false
+ image: prom/prometheus:v2.31.0
+```
+
+将上述资源全部应用到 Kubernetes 集群后,等待相关组件就绪。
+
+## 步骤三:配置 Grafana
+
+接下来我们通过配置 Grafana 进行可视化呈现。
+
+首先访问 `prometheus-grafana` 服务。注意,如果没有暴露 Service 到集群外部的手段,可以尝试使用端口转发的方式,Grafana
的管理员用户名和密码保存在 `prometheus-grafana` 这一 Secret 中。
+
+打开 Grafana 后,导入 APISIX Ingress Controller 的 [Dashboard
模版](https://raw.githubusercontent.com/apache/apisix-ingress-controller/22e548bc267115ccd36aec4200d5399aab565958/docs/assets/other/json/apisix-ingress-controller-grafana.json)即可看到监控大盘,效果图如下:
+
+
+
+
+
+
+创建 Dashboard 模版可参考[相关
PR](https://github.com/apache/apisix-ingress-controller/pull/731)。
+
+## 补充:监控指标释义
+
+目前 APISIX Ingress Controller 的监控指标聚焦于它和数据面 Apache APISIX
实例的交互(配置下发)上,包括配置同步的数量与延迟等相关数据。
+
+- `is_leader`:当前 APISIX Ingress Controller 实例是否为 Leader 角色。同一组 APISIX Ingress
Controller 只会有一个 Leader,其余实例均为 Candidate。
+- `sync_operations`:包括 APISIX Ingress Controller
向数据面同步配置时的一些指标,包括推送次数、失败率、延迟等。通过这类指标可以监控配置下发是否正常,以此来帮助研发和运维同学进行监控预警和故障定位。
+
+## 总结
+
+本文介绍了如何使用 Prometheus 监控 APISIX Ingress Controller
的相关步骤和部分指标的展示效果。目前只包含了一些基本的监控指标,我们会在后续继续进行打磨和升级,增加更多的指标项和集成数据面 APISIX
的指标,为大家带来更好的监控体验。
+
+当然也欢迎感兴趣的朋友参与 [Apache APISIX Ingress Controller
项目](https://github.com/apache/apisix-ingress-controller)的代码贡献中来,期待我们一起将 APISIX
Ingress Controller 打造地更加全面化。