gaobo0202 opened a new issue #5953:
URL: https://github.com/apache/apisix/issues/5953
### Issue description we use the / V1 / healthcheck interface of apisix to monitor alarms online, and false alarms will occur. The reason is that the /v1/healthcheck interface sometimes returns no data. 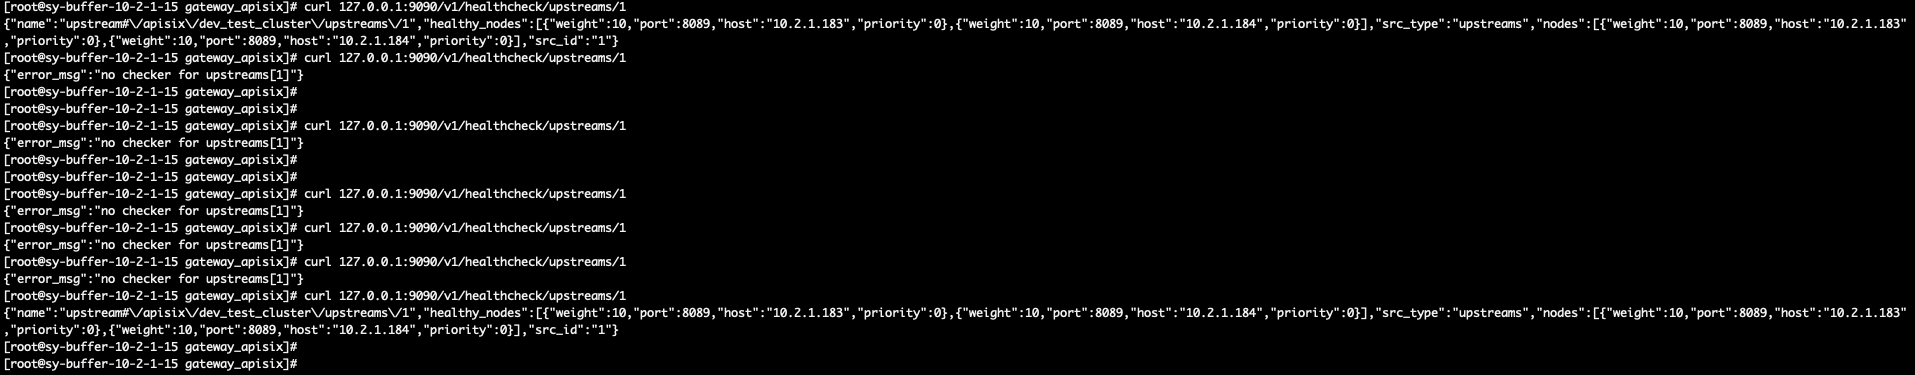 ### Environment - apisix version (cmd: `apisix version`):2.10.0 - OS (cmd: `uname -a`): - OpenResty / Nginx version (cmd: `nginx -V` or `openresty -V`): - etcd version, if have (cmd: run `curl http://127.0.0.1:9090/v1/server_info` to get the info from server-info API): - apisix-dashboard version, if have: - the plugin runner version, if the issue is about a plugin runner (cmd: depended on the kind of runner): - luarocks version, if the issue is about installation (cmd: `luarocks --version`): ### Steps to reproduce **Upstream configuration** `{ "nodes": [ { "host": "10.2.1.183", "port": 8089, "weight": 10 }, { "host": "10.2.1.184", "port": 8089, "weight": 10 } ], "timeout": { "connect": 3, "read": 60, "send": 30 }, "type": "roundrobin", "checks": { "active": { "concurrency": 10, "healthy": { "http_statuses": [ 200, 302 ], "interval": 1, "successes": 2 }, "http_path": "/health", "https_verify_certificate": true, "port": 8089, "timeout": 1, "type": "http", "unhealthy": { "http_failures": 5, "http_statuses": [ 429, 404, 500, 501, 502, 503, 504, 505 ], "interval": 1, "tcp_failures": 2, "timeouts": 3 } }, "passive": { "healthy": { "http_statuses": [ 200, 201, 202, 203, 204, 205, 206, 207, 208, 226, 300, 301, 302, 303, 304, 305, 306, 307, 308 ], "successes": 5 }, "type": "http", "unhealthy": { "http_failures": 2, "http_statuses": [ 429, 500, 503 ], "tcp_failures": 2, "timeouts": 7 } } }, "hash_on": "vars", "scheme": "http", "pass_host": "pass", "name": "cmdb-web" }` **Route configuration** `{ "cT": 0, "clusterId": 1, "createBy": 0, "desc": "", "enableWebsocket": false, "host": "cmdb-web.stage.sprucetec.com", "id": 1055, "methods": "[\"GET\",\"POST\",\"PUT\",\"DELETE\",\"PATCH\",\"HEAD\",\"OPTIONS\",\"CONNECT\",\"TRACE\"]", "name": "cmdb-web-spurcetec", "plugins": "{\"proxy-rewrite\":{\"disable\":false,\"host\":\"cmdb-web.stage.sprucetec.com\"},\"client-control\":{\"disable\":false,\"max_body_size\":10485760}}", "priority": 0, "status": 1, "uT": 1640696538832, "updateBy": 2, "updateTime": 1640696538832, "upstreamId": 1, "uris": "[\"/*\"]", "vars": "null" }` ### Actual result No result ### Error log No Error log ### Expected result _No response_ -- This is an automated message from the Apache Git Service. To respond to the message, please log on to GitHub and use the URL above to go to the specific comment. To unsubscribe, e-mail: [email protected] For queries about this service, please contact Infrastructure at: [email protected]