SylviaBABY commented on a change in pull request #876:
URL: https://github.com/apache/apisix-website/pull/876#discussion_r804370888
########## File path: website/blog/2022/02/10/apisix-splunk-integration.md ########## @@ -0,0 +1,192 @@ +--- +title: "Integrating Splunk HTTP Event Collector with Apache APISIX" +authors: + - name: "Jinchao Shuai" + title: "Author" + url: "https://github.com/shuaijinchao"; + image_url: "https://avatars.githubusercontent.com/u/8529452?v=4"; + - name: "Yilin Zeng" + title: "Technical Writer" + url: "https://github.com/yzeng25"; + image_url: "https://avatars.githubusercontent.com/u/36651058?v=4"; +keywords: +- Apache APISIX +- Logging +- Observability +- Ecosystem +description: This article explains how to configure and use the Splunk HEC service in Apache APISIX. +tags: [Technology,Ecosystem,Logging] +--- + +> This article explains how to configure and use the Splunk HEC service in Apache APISIX. + +<!--truncate--> + +The complexity of systems is increasing as technology iterates and enterprise architecture evolves. **Logs can support and be compatible with different analysis engines to reduce the cost for users in the selection, operation and maintenance process.** Log-based analysis and observation plays a very important role as the cornerstone to ensure system stability. + +Apache APISIX is not only an API Gateway with exceptional performance, but also has supported most of the mainstream open source and commercial logging solutions through the communication with community users on data and logging operation and maintenance, including: [HTTP Logger](https://github.com/apache/apisix/blob/master/docs/en/latest/plugins/http-logger.md), [TCP Logger](https://github.com/apache/apisix/blob/master/docs/en/latest/plugins/tcp-logger.md), [Kafka Logger](https://github.com/apache/apisix/blob/master/docs/en/latest/plugins/kafka-logger.md), [UDP Logger](https://github.com/apache/apisix/blob/master/docs/en/latest/plugins/udp-logger.md), [RocketMQ Logger](https://github.com/apache/apisix/blob/master/docs/en/latest/plugins/rocketmq-logger.md), [SkyWalking Logger](https://github.com/apache/apisix/blob/master/docs/en/latest/plugins/skywalking-logger.md), [Aliyun Cloud Logging(SLS)](https://github.com/apache/apisix/blob/master/docs/en/latest/plugins/sls-logger.md), [Googl e Cloud Logging](https://github.com/apache/apisix/blob/master/docs/en/latest/plugins/google-cloud-logging.md), etc. + +We now have a new addition to the Apache APISIX Logger support matrix: [Splunk HEC Logging](https://github.com/apache/apisix/blob/master/docs/en/latest/plugins/google-cloud-logging.md). + +This article explains how to configure and use the [Splunk HEC](https://docs.splunk.com/Documentation/Splunk/8.2.3/Data/TroubleshootHTTPEventCollector) service in Apache APISIX. + +## About Splunk HTTP Event Collector + +[Splunk](https://www.splunk.com/) is a full-text search engine for machine data that can be used to collect, index, search, and analyze data from a variety of applications. According to DB Engines' search engine ranking, Splunk is currently in second place and is a widely used full-text search software. Splunk, like ElasticSearch, is a quasi-real-time data stream that provides uninterrupted search results. + +[Splunk HTTP Event Collector (HEC)](https://docs.splunk.com/Documentation/Splunk/latest/Data/UsetheHTTPEventCollector)is an HTTP event collector provided by Splunk that provides the ability to send data and application events to Splunk using the HTTP(S) protocol. + +## About splunk-hec-logging lugin + +The [splunk-hec-logging](https://github.com/apache/apisix/blob/master/docs/en/latest/plugins/splunk-hec-logging.md) is used to forward Apache APISIX request logs to Splunk for analysis and storage. When enabled, Apache APISIX will take the request context information during the Log phase, serialize it into [Splunk Event Data 格式](https://docs.splunk.com/Documentation/Splunk/latest/Data/FormateventsforHTTPEventCollector#Event_metadata) and submit it to the batch queue. The data in the queue is committed to Splunk HEC when the maximum processing capacity of the batch queue per batch is triggered, or when the maximum time to refresh the buffer is reached. + +## How to use the splunk-hec-logging plugin + +### Splunk Configuration + +#### Deploy Splunk Enterprise + +Please refer to [Splunk's installation guide](https://docs.splunk.com/Documentation/Splunk/8.2.3/Installation/Chooseyourplatform) for deployment. This article will demonstrate deployment via Docker. + +Docker command parameters are as follows. + +```shell +docker run -p 18088:8088 -p 18000:8000 \ # 8088 is the HEC port, 8000 is the management backend port + -e "SPLUNK_PASSWORD=your-password" \ # Admin Login Password + -e "SPLUNK_START_ARGS=--accept-license" \ # Accept the license terms (Splunk will provide an Enterprise Trial License by default) + -e "SPLUNK_HEC_TOKEN=your-hec-token" \ # Set the default HEC token, this will create a default HEC after configuration + -itd --rm --name splunk-example splunk/splunk:latest +``` + +The command parameters are explained in the [Docker Splunk Documentation](https://splunk.github.io/docker-splunk/). + +#### Configure Splunk HEC + +The default HEC is already configured and created in Docker, so we won't go into the process of creating it here. For details on the manual creation process, please refer to the documentation: [Set up and use HTTP Event Collector in Splunk Web](https://docs.splunk.com/Documentation/Splunk/8.2.3/Data/UsetheHTTPEventCollector). + +#### Login to Splunk Enterprise and check HEC + +Access the mapped port of Docker through the browser. Since you need to map the `8000` port of the management backend to the `18000` port of the host, you can access it from the browser by "loopback address plus port" on the host during operation. For example: http://127.0.0.1:18000, the default username for login is admin, and the password is the `SPLUNK_PASSWORD` value set in the environment variable in the above example. + +As shown in the figure below, it means the login is successful. + +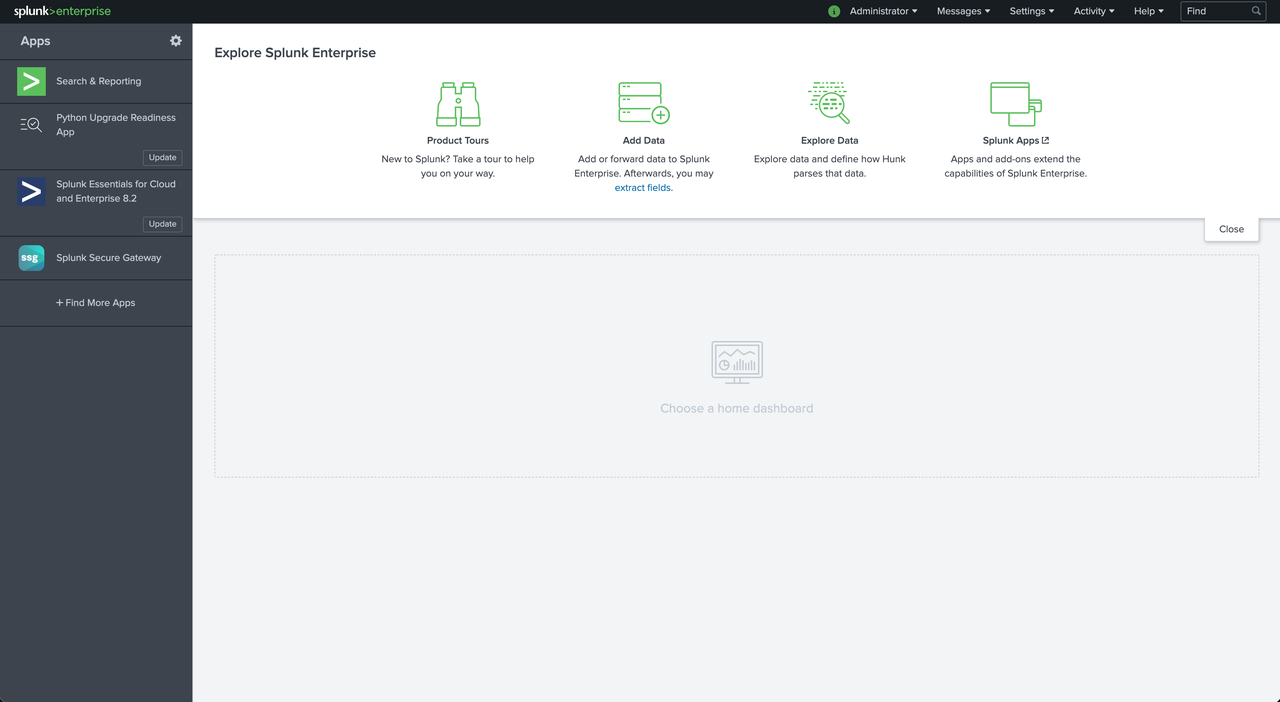 + +Click on "Settings > Data Inputs" at the top right of the screen to check if the default HEC is set successfully. + +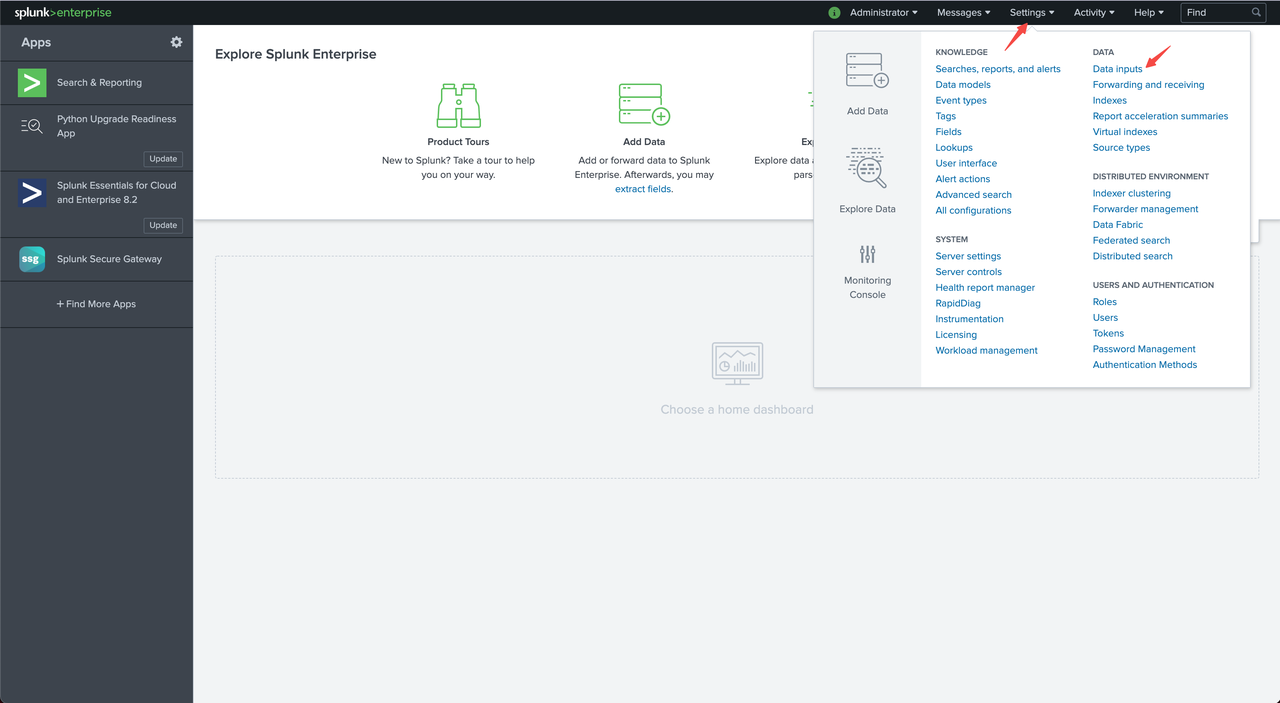 + +We can already see the number of HECs in the Inputs column of the HTTP Event Collector, indicating successful setup. + +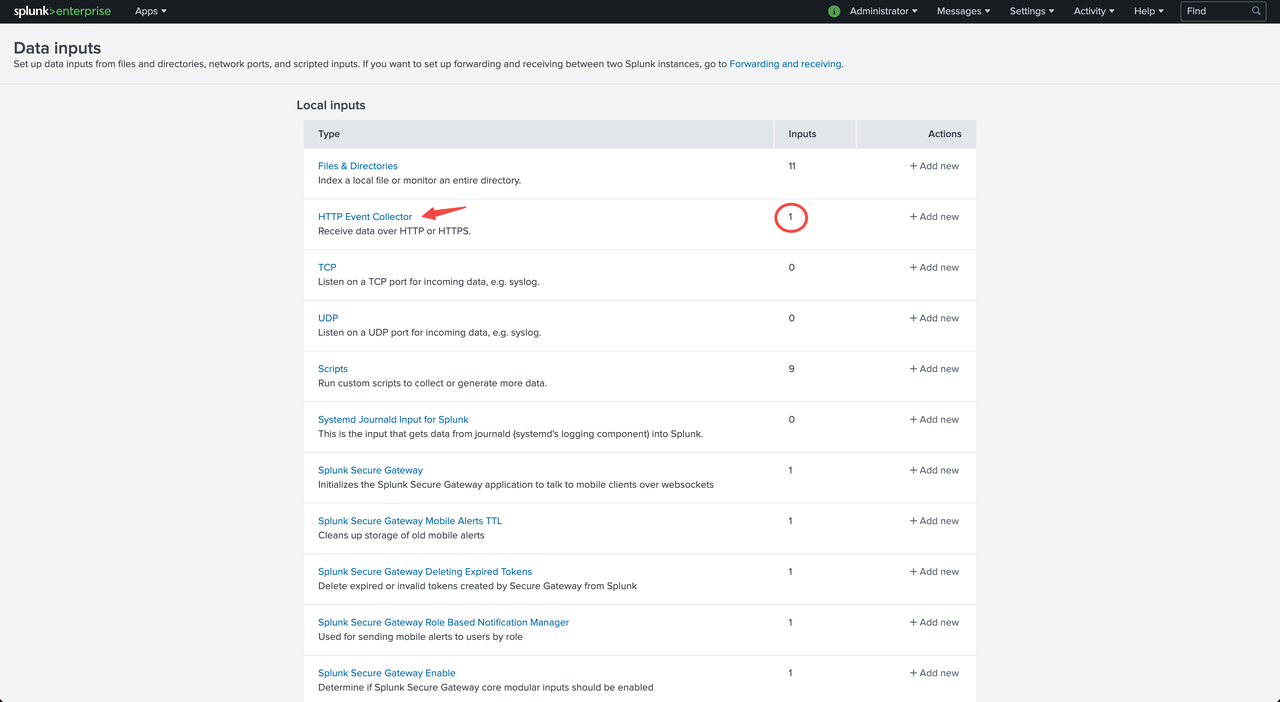 + +At this point, you can click HTTP Event Collector to enter the HEC details list to view the Token information of HECs. + +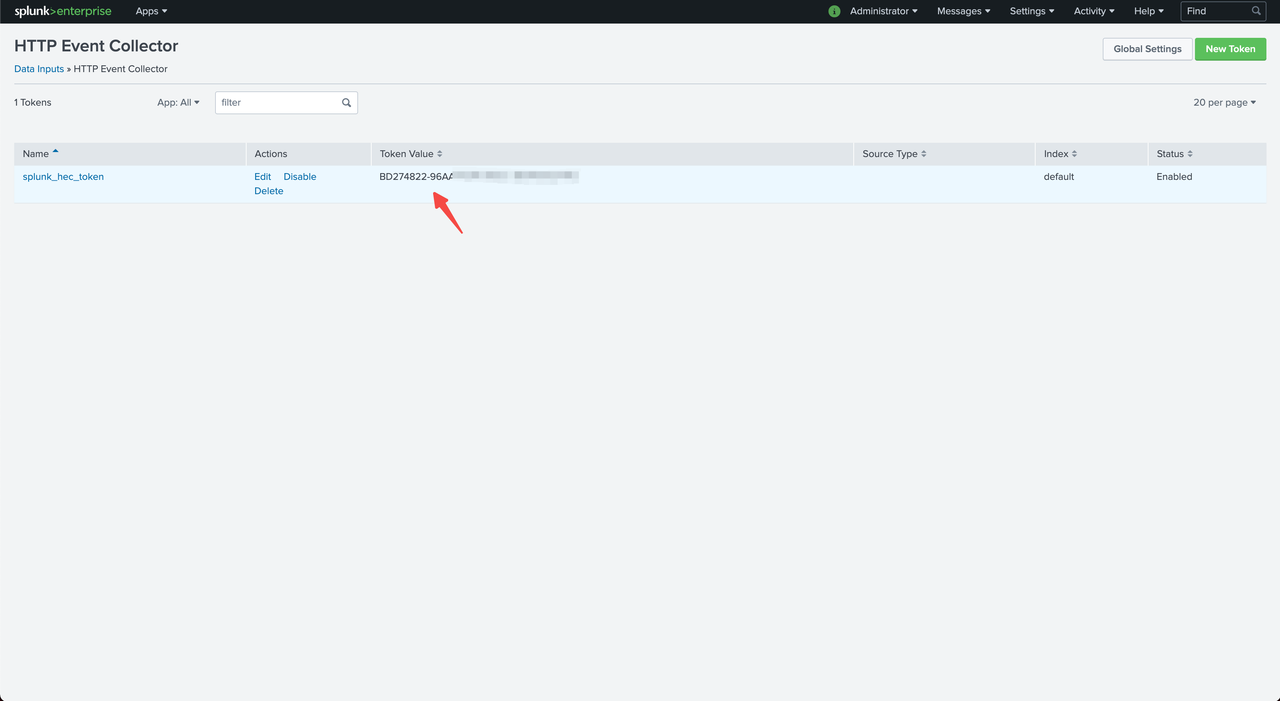 + +Token Values is the value of `SPLUNK_HEC_TOKEN` configured in the Docker environment variable above. + +### Apache APISIX Configuration + +#### Enable the splunk-hec-logging plugin + +Run the following command to enable the `splunk-hec-logging` plugin. + +```shell +curl http://127.0.0.1:9080/apisix/admin/routes/1 -H 'X-API-KEY: edd1c9f034335f136f87ad84b625c8f1' -X PUT -d ' +{ + "plugins":{ + "splunk-hec-logging":{ + "endpoint":{ + // HEC endpoint + "uri":"http://127.0.0.1:18088/services/collector";, + // HEC Token + "token":"BD274822-96AA-4DA6-90EC-18940FB2414C" + }, + // // Maximum time (in seconds) to refresh the batch queue buffer + "inactive_timeout":2, + // Maximum number of log entries per batch queue + "batch_max_size":10 + } + }, + "upstream":{ + "type":"roundrobin", + "nodes":{ + "127.0.0.1:1980":1 + } + }, + "uri":"/splunk.do" +}' +``` + +The plug-in parameters are described in the following table. + +|Name|Required|Default Value|Description| +|----|----|----|----| +|endpoint|Yes|N/A|Splunk HEC Endpoint Configuration Information| +|endpoint.uri|Yes|N/A|Splunk HEC Event Collection API| +|endpoint.token|Yes|N/A|Splunk HEC Identity Token| +|endpoint.channel|No|N/A|Splunk HEC send channel identification, refer to: [About HTTP Event Collector Indexer Acknowledgment](https://docs.splunk.com/Documentation/Splunk/8.2.3/Data/AboutHECIDXAck)| +|endpoint.timeout|No|10|Splunk HEC data submission timeout in seconds.| +|ssl_verify|No|TRUE|Enable SSL authentication, refer to: [OpenResty Documentation](https://github.com/openresty/lua-nginx-module#tcpsocksslhandshake).| +|max_retry_count|No|0|Maximum number of retries before removal from the processing pipeline.| +|retry_delay|No|1|Number of seconds that process execution should be delayed if execution fails.| +|buffer_duration|No|60|The maximum duration (in seconds) of the oldest entry in the batch must be processed first.| +|inactive_timeout|No|5|Maximum time to refresh the buffer in seconds.| +|batch_max_size|No|1000|Maximum number of entries per batch queue.| + +#### Send the request + +Run the following command to send a request to Splunk. + +```shell +$ curl -i http://127.0.0.1:9080/splink.do +HTTP/1.1 200 OK +Content-Type: text/html; charset=utf-8 +Transfer-Encoding: chunked +Connection: keep-alive +Date: Fri, 10 Dec 2021 09:57:52 GMT +Server: APISIX/2.11.0 + +Hello, Splunk HEC Logging +``` + +#### Verify the log + +Log in to the Splunk console and click "Search & Reporting". + + + +Type `source="apache-apisix-splunk-hec-logging"` in the search box to query the sent request logs. + +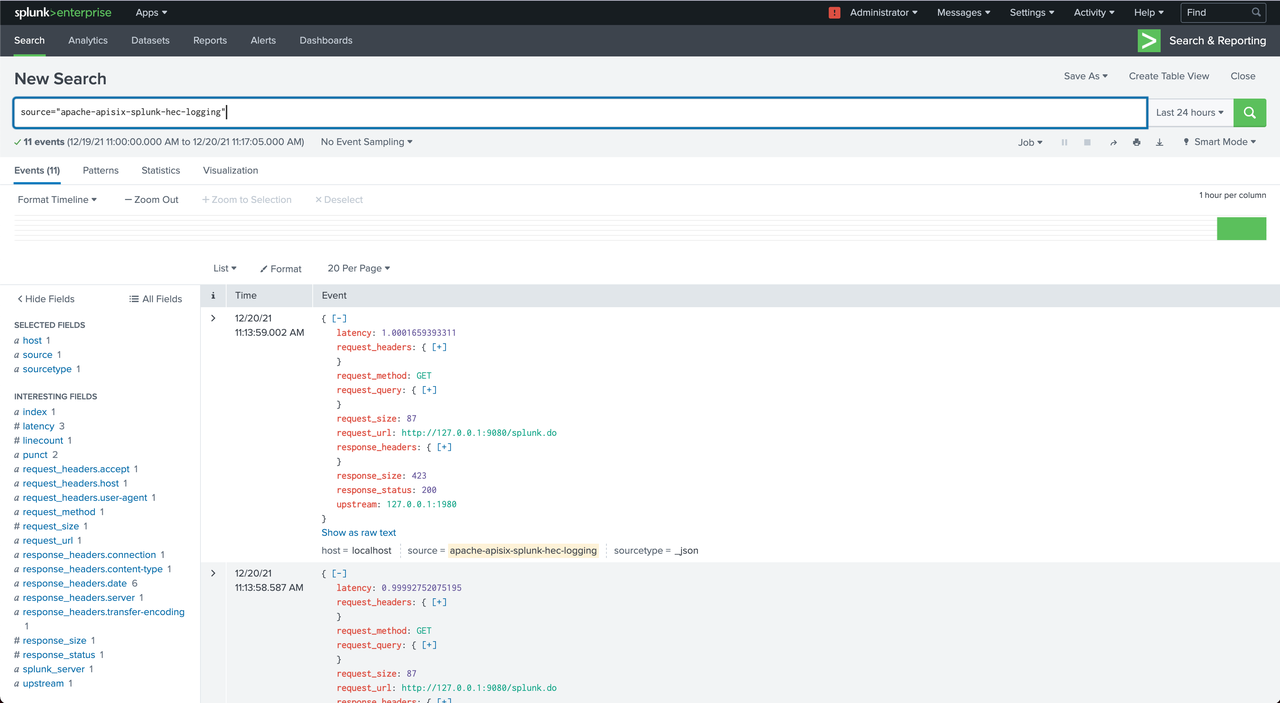 + +#### Disable the splunk-hec-logging plugin + +Remove the `splunk-hec-logging` configuration to disable the plugin. + +```shell +curl http://127.0.0.1:9080/apisix/admin/routes/1 -H 'X-API-KEY: edd1c9f034335f136f87ad84b625c8f1' -X PUT -d ' +{ + "uri":"/logging.do", + "upstream":{ + "type":"roundrobin", + "nodes":{ + "127.0.0.1:1980":1 + } + }, + "plugins":{ + } +}' +``` + +## Summary + +Apache APISIX is also currently working on additional plugins to support integration with more services, so if you're interested, feel free to start a discussion thread in our [GitHub Discussion](https://github.com/apache/apisix/discussions) or communicate via the mailing list. Review comment: “via the mailing list” no link -- This is an automated message from the Apache Git Service. To respond to the message, please log on to GitHub and use the URL above to go to the specific comment. To unsubscribe, e-mail: [email protected] For queries about this service, please contact Infrastructure at: [email protected]