This is an automated email from the ASF dual-hosted git repository.

juzhiyuan pushed a commit to branch master
in repository https://gitbox.apache.org/repos/asf/apisix-website.git
The following commit(s) were added to refs/heads/master by this push:
new d8178b9 docs: added splunk blog (#876)
d8178b9 is described below
commit d8178b979ba7b46226a4c74133ff94d6ec272ed5
Author: yilinzeng <[email protected]>
AuthorDate: Fri Feb 11 14:52:14 2022 +0800
docs: added splunk blog (#876)
---
.../blog/2022/02/10/apisix-splunk-integration.md | 192 +++++++++++++++++++++
.../2022/02/10/apisix-splunk-integration.md | 191 ++++++++++++++++++++
2 files changed, 383 insertions(+)
diff --git a/website/blog/2022/02/10/apisix-splunk-integration.md
b/website/blog/2022/02/10/apisix-splunk-integration.md
new file mode 100644
index 0000000..ccead21
--- /dev/null
+++ b/website/blog/2022/02/10/apisix-splunk-integration.md
@@ -0,0 +1,192 @@
+---
+title: "Integrating Splunk HTTP Event Collector with Apache APISIX"
+authors:
+ - name: "Jinchao Shuai"
+ title: "Author"
+ url: "https://github.com/shuaijinchao";
+ image_url: "https://avatars.githubusercontent.com/u/8529452?v=4";
+ - name: "Yilin Zeng"
+ title: "Technical Writer"
+ url: "https://github.com/yzeng25";
+ image_url: "https://avatars.githubusercontent.com/u/36651058?v=4";
+keywords:
+- Apache APISIX
+- Logging
+- Observability
+- Ecosystem
+description: This article explains how to configure and use the Splunk HEC
service in Apache APISIX.
+tags: [Technology,Ecosystem,Logging]
+---
+
+> This article explains how to configure and use the Splunk HEC service in
Apache APISIX.
+
+<!--truncate-->
+
+The complexity of systems is increasing as technology iterates and enterprise
architecture evolves. **Logs can support and be compatible with different
analysis engines to reduce the cost for users in the selection, operation and
maintenance process.** Log-based analysis and observation plays a very
important role as the cornerstone to ensure system stability.
+
+Apache APISIX is not only an API Gateway with exceptional performance, but
also has supported most of the mainstream open source and commercial logging
solutions through the communication with community users on data and logging
operation and maintenance, including: [HTTP
Logger](https://github.com/apache/apisix/blob/master/docs/en/latest/plugins/http-logger.md),
[TCP
Logger](https://github.com/apache/apisix/blob/master/docs/en/latest/plugins/tcp-logger.md),
[Kafka Logger](https://github [...]
+
+We now have a new addition to the Apache APISIX Logger support matrix: [Splunk
HEC
Logging](https://github.com/apache/apisix/blob/master/docs/en/latest/plugins/google-cloud-logging.md).
+
+This article explains how to configure and use the [Splunk
HEC](https://docs.splunk.com/Documentation/Splunk/8.2.3/Data/TroubleshootHTTPEventCollector)
service in Apache APISIX.
+
+## About Splunk HTTP Event Collector
+
+[Splunk](https://www.splunk.com/) is a full-text search engine for machine
data that can be used to collect, index, search, and analyze data from a
variety of applications. According to DB Engines' search engine ranking, Splunk
is currently in second place and is a widely used full-text search software.
Splunk, like ElasticSearch, is a quasi-real-time data stream that provides
uninterrupted search results.
+
+[Splunk HTTP Event Collector
(HEC)](https://docs.splunk.com/Documentation/Splunk/latest/Data/UsetheHTTPEventCollector)is
an HTTP event collector provided by Splunk that provides the ability to send
data and application events to Splunk using the HTTP(S) protocol.
+
+## About splunk-hec-logging lugin
+
+The
[splunk-hec-logging](https://github.com/apache/apisix/blob/master/docs/en/latest/plugins/splunk-hec-logging.md)
is used to forward Apache APISIX request logs to Splunk for analysis and
storage. When enabled, Apache APISIX will take the request context information
during the Log phase, serialize it into [Splunk Event Data
格式](https://docs.splunk.com/Documentation/Splunk/latest/Data/FormateventsforHTTPEventCollector#Event_metadata)
and submit it to the batch queue. The data in the queu [...]
+
+## How to use the splunk-hec-logging plugin
+
+### Splunk Configuration
+
+#### Deploy Splunk Enterprise
+
+Please refer to [Splunk's installation
guide](https://docs.splunk.com/Documentation/Splunk/8.2.3/Installation/Chooseyourplatform)
for deployment. This article will demonstrate deployment via Docker.
+
+Docker command parameters are as follows.
+
+```shell
+docker run -p 18088:8088 -p 18000:8000 \ # 8088 is the HEC port, 8000 is
the management backend port
+ -e "SPLUNK_PASSWORD=your-password" \ # Admin Login Password
+ -e "SPLUNK_START_ARGS=--accept-license" \ # Accept the license terms (Splunk
will provide an Enterprise Trial License by default)
+ -e "SPLUNK_HEC_TOKEN=your-hec-token" \ # Set the default HEC token, this
will create a default HEC after configuration
+ -itd --rm --name splunk-example splunk/splunk:latest
+```
+
+The command parameters are explained in the [Docker Splunk
Documentation](https://splunk.github.io/docker-splunk/).
+
+#### Configure Splunk HEC
+
+The default HEC is already configured and created in Docker, so we won't go
into the process of creating it here. For details on the manual creation
process, please refer to the documentation: [Set up and use HTTP Event
Collector in Splunk
Web](https://docs.splunk.com/Documentation/Splunk/8.2.3/Data/UsetheHTTPEventCollector).
+
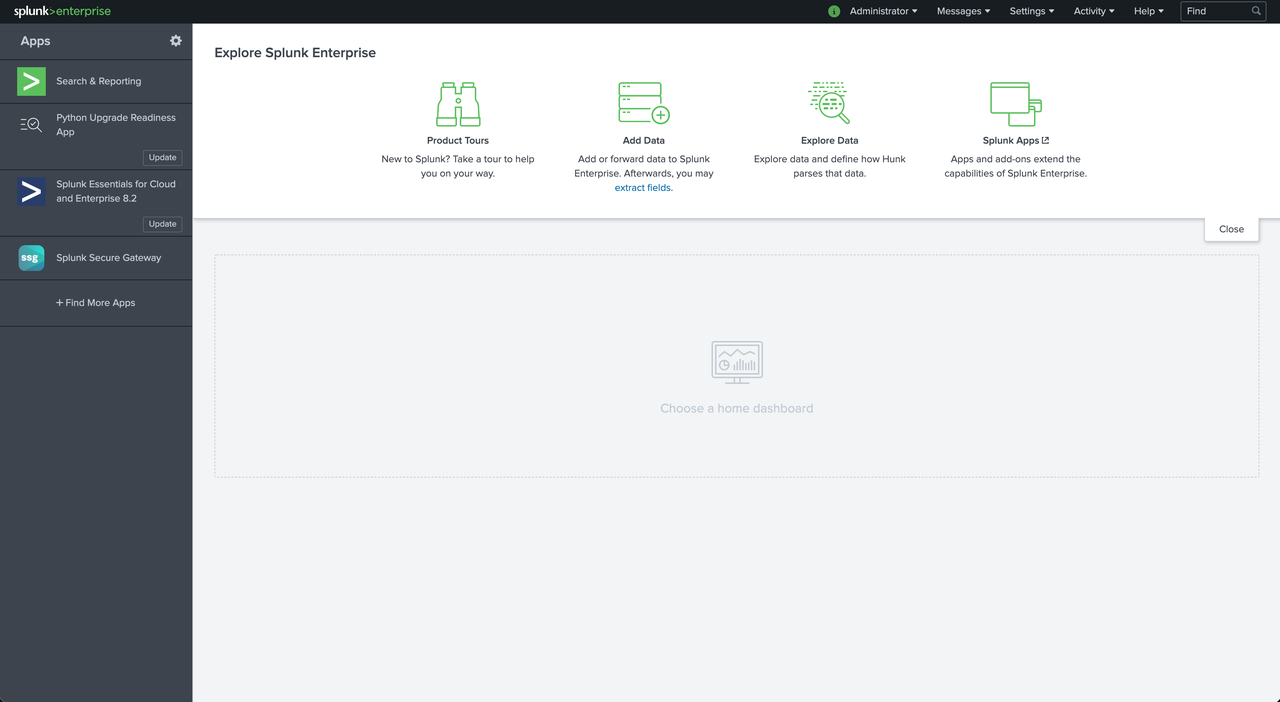
+#### Login to Splunk Enterprise and check HEC
+
+Access the mapped port of Docker through the browser. Since you need to map
the `8000` port of the management backend to the `18000` port of the host, you
can access it from the browser by "loopback address plus port" on the host
during operation. For example: http://127.0.0.1:18000, the default username for
login is admin, and the password is the `SPLUNK_PASSWORD` value set in the
environment variable in the above example.
+
+As shown in the figure below, it means the login is successful.
+
+
+
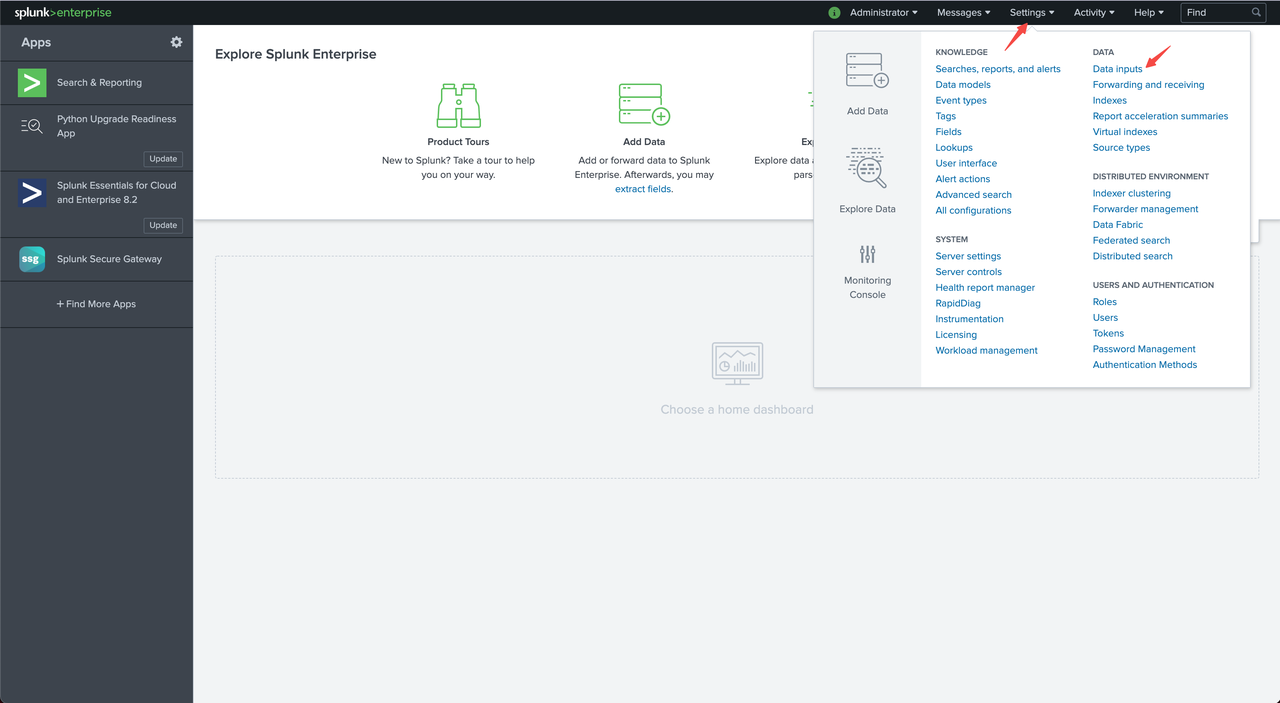
+Click on "Settings > Data Inputs" at the top right of the screen to check if
the default HEC is set successfully.
+
+
+
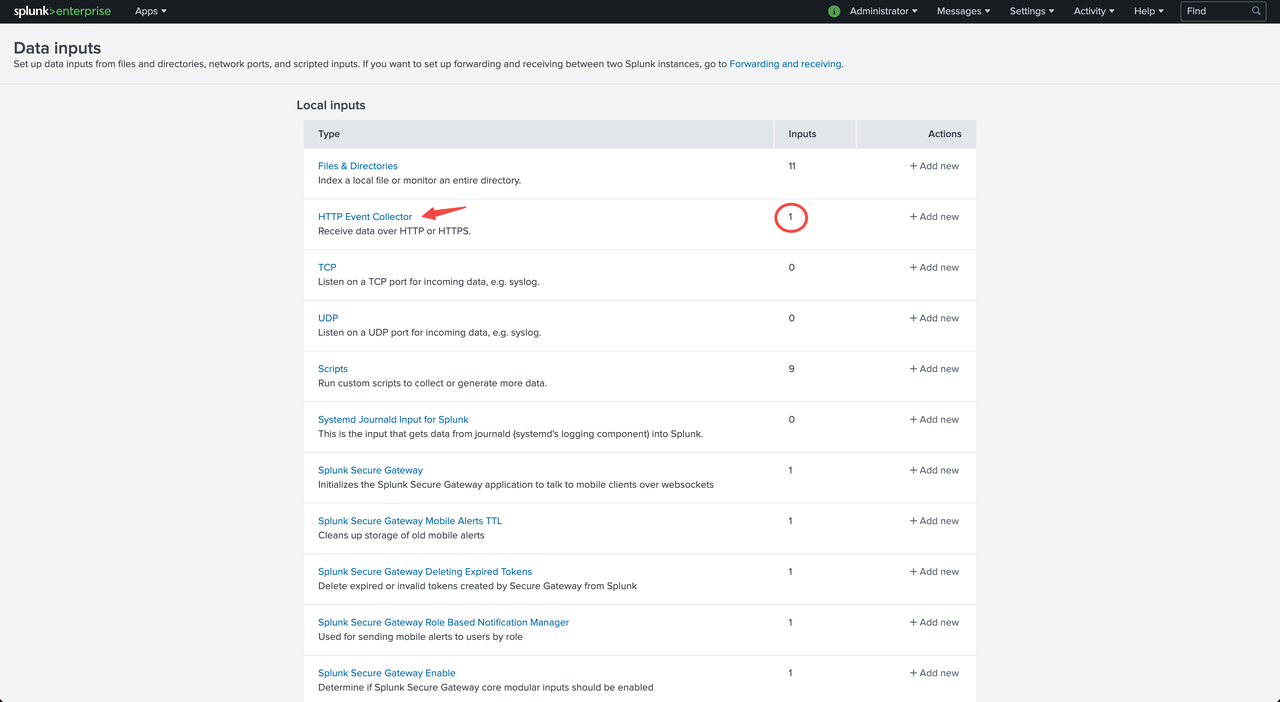
+We can already see the number of HECs in the Inputs column of the HTTP Event
Collector, indicating successful setup.
+
+
+
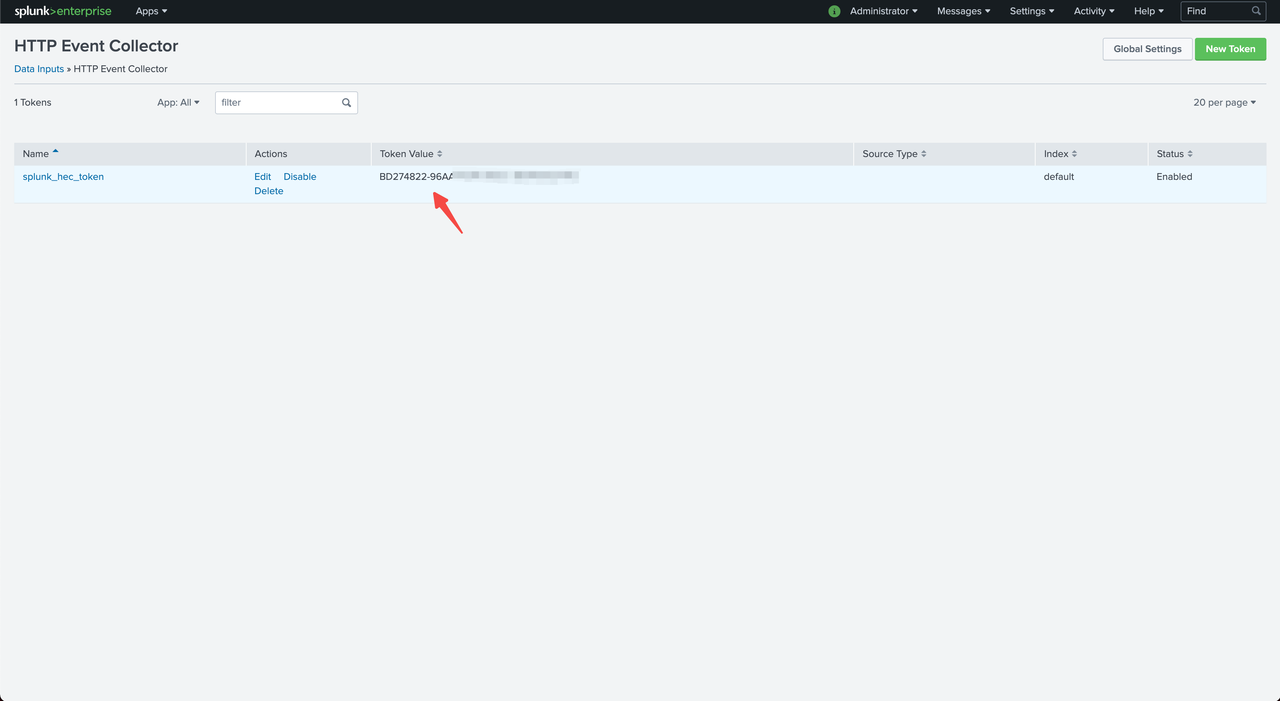
+At this point, you can click HTTP Event Collector to enter the HEC details
list to view the Token information of HECs.
+
+
+
+Token Values is the value of `SPLUNK_HEC_TOKEN` configured in the Docker
environment variable above.
+
+### Apache APISIX Configuration
+
+#### Enable the splunk-hec-logging plugin
+
+Run the following command to enable the `splunk-hec-logging` plugin.
+
+```shell
+curl http://127.0.0.1:9080/apisix/admin/routes/1 -H 'X-API-KEY:
edd1c9f034335f136f87ad84b625c8f1' -X PUT -d '
+{
+ "plugins":{
+ "splunk-hec-logging":{
+ "endpoint":{
+ // HEC endpoint
+ "uri":"http://127.0.0.1:18088/services/collector";,
+ // HEC Token
+ "token":"BD274822-96AA-4DA6-90EC-18940FB2414C"
+ },
+ // // Maximum time (in seconds) to refresh the batch queue buffer
+ "inactive_timeout":2,
+ // Maximum number of log entries per batch queue
+ "batch_max_size":10
+ }
+ },
+ "upstream":{
+ "type":"roundrobin",
+ "nodes":{
+ "127.0.0.1:1980":1
+ }
+ },
+ "uri":"/splunk.do"
+}'
+```
+
+The plug-in parameters are described in the following table.
+
+|Name|Required|Default Value|Description|
+|----|----|----|----|
+|endpoint|Yes|N/A|Splunk HEC Endpoint Configuration Information|
+|endpoint.uri|Yes|N/A|Splunk HEC Event Collection API|
+|endpoint.token|Yes|N/A|Splunk HEC Identity Token|
+|endpoint.channel|No|N/A|Splunk HEC send channel identification, refer to:
[About HTTP Event Collector Indexer
Acknowledgment](https://docs.splunk.com/Documentation/Splunk/8.2.3/Data/AboutHECIDXAck)|
+|endpoint.timeout|No|10|Splunk HEC data submission timeout in seconds.|
+|ssl_verify|No|TRUE|Enable SSL authentication, refer to: [OpenResty
Documentation](https://github.com/openresty/lua-nginx-module#tcpsocksslhandshake).|
+|max_retry_count|No|0|Maximum number of retries before removal from the
processing pipeline.|
+|retry_delay|No|1|Number of seconds that process execution should be delayed
if execution fails.|
+|buffer_duration|No|60|The maximum duration (in seconds) of the oldest entry
in the batch must be processed first.|
+|inactive_timeout|No|5|Maximum time to refresh the buffer in seconds.|
+|batch_max_size|No|1000|Maximum number of entries per batch queue.|
+
+#### Send the request
+
+Run the following command to send a request to Splunk.
+
+```shell
+$ curl -i http://127.0.0.1:9080/splink.do
+HTTP/1.1 200 OK
+Content-Type: text/html; charset=utf-8
+Transfer-Encoding: chunked
+Connection: keep-alive
+Date: Fri, 10 Dec 2021 09:57:52 GMT
+Server: APISIX/2.11.0
+
+Hello, Splunk HEC Logging
+```
+
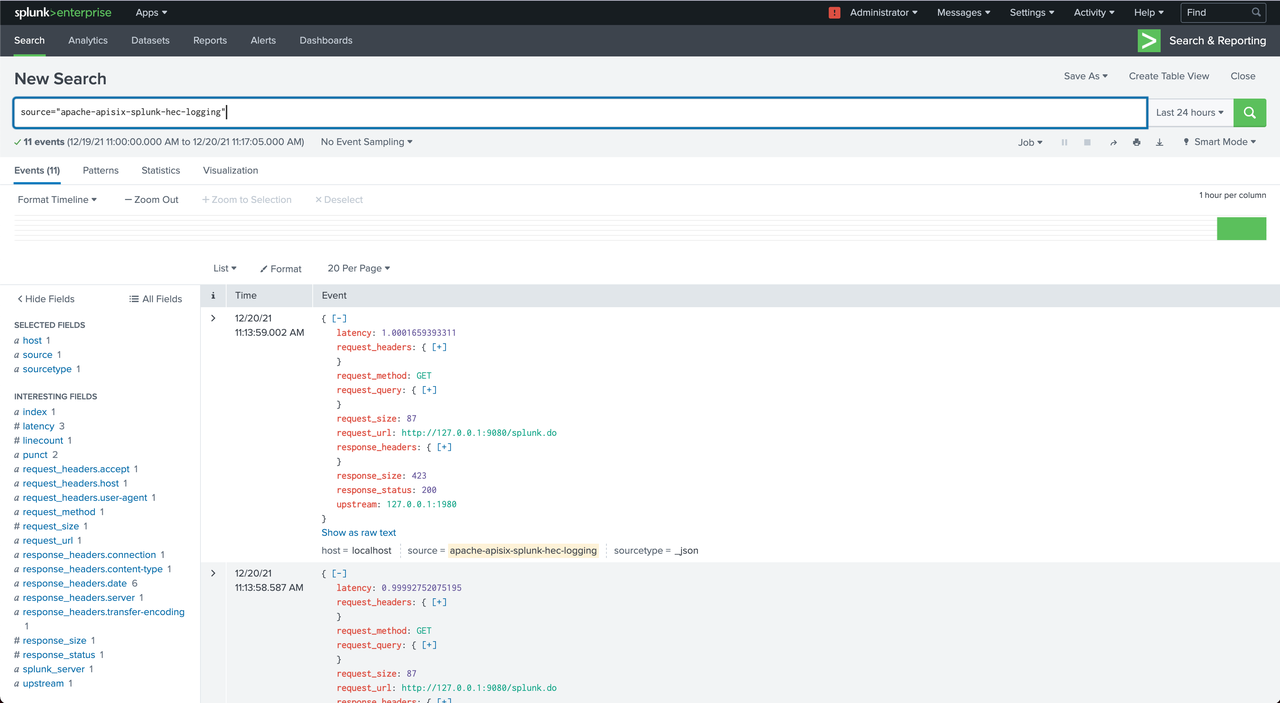
+#### Verify the log
+
+Log in to the Splunk console and click "Search & Reporting".
+
+
+
+Type `source="apache-apisix-splunk-hec-logging"` in the search box to query
the sent request logs.
+
+
+
+#### Disable the splunk-hec-logging plugin
+
+Remove the `splunk-hec-logging` configuration to disable the plugin.
+
+```shell
+curl http://127.0.0.1:9080/apisix/admin/routes/1 -H 'X-API-KEY:
edd1c9f034335f136f87ad84b625c8f1' -X PUT -d '
+{
+ "uri":"/logging.do",
+ "upstream":{
+ "type":"roundrobin",
+ "nodes":{
+ "127.0.0.1:1980":1
+ }
+ },
+ "plugins":{
+ }
+}'
+```
+
+## Summary
+
+Apache APISIX is also currently working on additional plugins to support
integration with more services, so if you're interested, feel free to start a
discussion thread in our [GitHub
Discussion](https://github.com/apache/apisix/discussions) or communicate via
the [mailing list](https://apisix.apache.org/zh/docs/general/subscribe-guide).
+
+## Related articles
+
+- [Apache APISIX Integration with Kafka for Efficient Real-Time Log
Monitoring](https://apisix.apache.org/blog/2022/01/17/apisix-kafka-integration)
+- [Apache APISIX & RocketMQ Helps User API Log Monitoring
Capabilities](https://apisix.apache.org/blog/2021/12/08/apisix-integrate-rocketmq-logger-plugin)
+- [Apache APISIX Integrates with Google Cloud Logging to Improve Log
Processing](https://apisix.apache.org/blog/2021/12/22/google-logging)
+- [Apache APISIX Integrates with SkyWalking to Create a Full Range of Log
Processing](https://apisix.apache.org/blog/2021/12/07/apisix-integrate-skywalking-plugin)
diff --git
a/website/i18n/zh/docusaurus-plugin-content-blog/2022/02/10/apisix-splunk-integration.md
b/website/i18n/zh/docusaurus-plugin-content-blog/2022/02/10/apisix-splunk-integration.md
new file mode 100644
index 0000000..59d4b8a
--- /dev/null
+++
b/website/i18n/zh/docusaurus-plugin-content-blog/2022/02/10/apisix-splunk-integration.md
@@ -0,0 +1,191 @@
+---
+title: "生态扩大进行中!Apache APISIX 集成 Splunk HTTP Event Collector"
+authors:
+ - name: "帅进超"
+ title: "Author"
+ url: "https://github.com/shuaijinchao";
+ image_url: "https://avatars.githubusercontent.com/u/8529452?v=4";
+ - name: "曾奕霖"
+ title: "Technical Writer"
+ url: "https://github.com/yzeng25";
+ image_url: "https://avatars.githubusercontent.com/u/36651058?v=4";
+keywords:
+- Apache APISIX
+- 日志
+- 可观测性
+- 生态
+description: 本文将为大家介绍如何在 Apache APISIX 中配置和使用 Splunk HEC 服务。
+tags: [Technology,Ecosystem,Logging]
+---
+
+> 本文将为大家介绍如何在 Apache APISIX 中配置和使用 Splunk HEC 服务。
+
+<!--truncate-->
+
+随着技术的不断迭代和企业架构的不断演进,系统的复杂度越来越高。**日志作为分析和观测的“原材料”,能支持和兼容不同的分析引擎会为用户在选型和后期运维过程中降低很大成本。**基于日志的分析和观测作为保障系统稳定的基石,它的角色非常重要。
+
+Apache APISIX 作为一个高性能的 API
网关不仅在性能上有着良好的表现,并且在数据和日志的运维上通过和社区用户的交流共建也已经支持了大部分主流的开源及商业日志解决方案,包括:[HTTP
Logger](https://github.com/apache/apisix/blob/master/docs/en/latest/plugins/http-logger.md)
、[TCP
Logger](https://github.com/apache/apisix/blob/master/docs/en/latest/plugins/tcp-logger.md)、[Kafka
Logger](https://github.com/apache/apisix/blob/master/docs/en/latest/plugins/kafka-logger.md)、[UDP
Logger](https://github.com/apache/apisix/blob/master/docs/en/latest/plugins/udp-logger.md)、[Rocket
[...]
+
+最近通过社区的共建支持,Apache APISIX 的 Logger 全家桶中又多了一位新成员:[Splunk HEC
Logging](https://github.com/apache/apisix/blob/master/docs/en/latest/plugins/google-cloud-logging.md)。
+
+本文将为大家介绍如何在 Apache APISIX 中配置和使用 [Splunk
HEC](https://docs.splunk.com/Documentation/Splunk/8.2.3/Data/TroubleshootHTTPEventCollector)
服务。
+
+## 关于 Splunk HTTP Event Collector
+
+[Splunk](https://www.splunk.com/) 是一个机器数据的全文搜索引擎,可应用于采集、索引、搜索和分析各种应用数据,根据 [DB
Engines 的检索引擎排名](https://db-engines.com/en/ranking/search+engine),目前 Splunk
位列第二,是一款应用广泛的全文检索软件。Splunk 和 ElasticSearch 一样,是准实时可以提供不间断搜索结果的数据流。
+
+[Splunk HTTP Event Collector
(HEC)](https://docs.splunk.com/Documentation/Splunk/latest/Data/UsetheHTTPEventCollector)
是 Splunk 提供的 HTTP 事件收集器,主要提供以 HTTP(S) 协议将数据和应用程序事件发送到 Splunk 的能力。
+
+## 关于 Splunk HEC Logging 插件
+
+[splunk-hec-logging](https://github.com/apache/apisix/blob/master/docs/zh/latest/plugins/splunk-hec-logging.md)
插件用于将 Apache APISIX 的请求日志转发到 Splunk 中进行分析和存储。启用该插件后,Apache APISIX 将在 Log
阶段获取请求上下文信息,并将其序列化为 [Splunk Event Data
格式](https://docs.splunk.com/Documentation/Splunk/latest/Data/FormateventsforHTTPEventCollector#Event_metadata)后提交到批处理队列中。当触发批处理队列每批次最大处理容量,或刷新缓冲区的最大时间时,会将队列中的数据提交到
Splunk HEC 中。
+
+## 如何使用 Splunk HEC Logging 插件
+
+### Splunk 配置步骤
+
+#### 部署 Splunk Enterprise
+
+请参考 Splunk 的
[官方安装指南](https://docs.splunk.com/Documentation/Splunk/8.2.3/Installation/Chooseyourplatform)
进行部署,本文将通过 Docker 进行部署演示。
+Docker 命令参数如下:
+
+```shell
+docker run -p 18088:8088 -p 18000:8000 \ # 8088为HEC端口,8000为管理后台端口
+ -e "SPLUNK_PASSWORD=your-password" \ # 管理后台登录密码
+ -e "SPLUNK_START_ARGS=--accept-license" \ # 接受许可证条款(Splunk默认将提供一张Enterprise
Trial License)
+ -e "SPLUNK_HEC_TOKEN=your-hec-token" \ # 设置默认HEC令牌,配置此项后将创建一个默认的HEC
+ -itd --rm --name splunk-example splunk/splunk:latest
+```
+
+命令参数具体释义可参考:[Docker Splunk 文档](https://splunk.github.io/docker-splunk/)。
+
+#### 配置 Splunk HEC
+
+Docker 中已经配置并创建了默认的 HEC,在这里不再过多赘述创建 HEC 的流程。具体手动创建的流程可参考文档:[Set up and use
HTTP Event Collector in Splunk
Web](https://docs.splunk.com/Documentation/Splunk/8.2.3/Data/UsetheHTTPEventCollector)。
+
+#### 登录 Splunk Enterprise 并检查 HEC
+
+通过浏览器访问 Docker 的映射端口。因为需要把管理后台的 `8000` 端口映射到宿主机的 `18000`
端口,所以在操作时可以在宿主机上通过「回环地址加端口」的方式在浏览器访问即可。例如:http://127.0.0.1:18000,登录的默认用户名是
admin,密码是在上例的环境变量中设置的 `SPLUNK_PASSWORD` 的值。
+
+如下图所示,表示登录成功。
+
+
+
+单击界面右上方 “Settings > Data Inputs” 检查默认 HEC 是否设置成功:
+
+
+
+在 HTTP Event Collector 的 Inputs 列中我们已经可以看到 HEC 的数量,表示设置成功。
+
+
+
+此时可以点击 HTTP Event Collector 进入 HEC 详情列表查看 HECs 的 Token 信息。
+
+
+
+Token Values 即在上文中 Docker 环境变量中配置的 `SPLUNK_HEC_TOKEN` 的值。
+
+### Apache APISIX 配置步骤
+
+#### 启用插件
+
+运行以下命令,启用 `splunk-hec-logging` 插件。
+
+```shell
+curl http://127.0.0.1:9080/apisix/admin/routes/1 -H 'X-API-KEY:
edd1c9f034335f136f87ad84b625c8f1' -X PUT -d '
+{
+ "plugins":{
+ "splunk-hec-logging":{
+ "endpoint":{
+ // HEC 端点地址
+ "uri":"http://127.0.0.1:18088/services/collector";,
+ // HEC Token
+ "token":"BD274822-96AA-4DA6-90EC-18940FB2414C"
+ },
+ // // 刷新批处理队列缓冲区的最大时间(以秒为单位)
+ "inactive_timeout":2,
+ // 每个批处理队列最大容纳日志条目数
+ "batch_max_size":10
+ }
+ },
+ "upstream":{
+ "type":"roundrobin",
+ "nodes":{
+ "127.0.0.1:1980":1
+ }
+ },
+ "uri":"/splunk.do"
+}'
+```
+
+插件参数说明如下表所示。
+
+|名称|是否必填|默认值|描述|
+|----|----|----|----|
+|endpoint|是|N/A|Splunk HEC 端点配置信息|
+|endpoint.uri|是|N/A|Splunk HEC 事件收集API|
+|endpoint.token|是|N/A|Splunk HEC 身份令牌|
+|endpoint.channel|否|N/A|Splunk HEC 发送渠道标识,参考:[About HTTP Event Collector
Indexer
Acknowledgment](https://docs.splunk.com/Documentation/Splunk/8.2.3/Data/AboutHECIDXAck)|
+|endpoint.timeout|否|10|Splunk HEC 数据提交超时时间(以秒为单位)|
+|ssl_verify|否|TRUE|启用 SSL 验证, 参考:[OpenResty
文档](https://github.com/openresty/lua-nginx-module#tcpsocksslhandshake)|
+|max_retry_count|否|0|从处理管道中移除之前的最大重试次数|
+|retry_delay|否|1|如果执行失败,流程执行应延迟的秒数|
+|buffer_duration|否|60|必须先处理批次中最旧条目的最大期限(以秒为单位)|
+|inactive_timeout|否|5|刷新缓冲区的最大时间(以秒为单位)|
+|batch_max_size|否|1000|每个批处理队列可容纳的最大条目数|
+
+#### 发送请求
+
+运行以下命令,向 Splunk 发送请求。
+
+```shell
+$ curl -i http://127.0.0.1:9080/splink.do
+HTTP/1.1 200 OK
+Content-Type: text/html; charset=utf-8
+Transfer-Encoding: chunked
+Connection: keep-alive
+Date: Fri, 10 Dec 2021 09:57:52 GMT
+Server: APISIX/2.11.0
+
+Hello, Splunk HEC Logging
+```
+
+#### 验证日志
+
+登录 Splunk 控制台,点击 “Search & Reporting”。
+
+
+
+在搜索输入框中输入:`source="apache-apisix-splunk-hec-logging"`,即可查询到发送的请求日志。
+
+
+
+#### 停用插件
+
+移除 `splunk-hec-logging` 相关配置即可。
+
+```shell
+curl http://127.0.0.1:9080/apisix/admin/routes/1 -H 'X-API-KEY:
edd1c9f034335f136f87ad84b625c8f1' -X PUT -d '
+{
+ "uri":"/logging.do",
+ "upstream":{
+ "type":"roundrobin",
+ "nodes":{
+ "127.0.0.1:1980":1
+ }
+ },
+ "plugins":{
+ }
+}'
+```
+
+## 总结
+
+目前,Apache APISIX 也在开发其他插件以支持集成更多服务,如果您对此感兴趣,欢迎随时在 [GitHub
Discussion](https://github.com/apache/apisix/discussions)
中发起讨论,也可通过[邮件列表](https://apisix.apache.org/zh/docs/general/subscribe-guide)进行交流。
+
+## 相关阅读
+
+- [Apache APISIX 集成 Kafka
实现高效率实时日志监控](https://apisix.apache.org/zh/blog/2022/01/17/apisix-kafka-integration)
+- [Apache APISIX 携手 RocketMQ 为实时 API
日志监控功能再下一城](https://apisix.apache.org/zh/blog/2021/12/08/apisix-integrate-rocketmq-logger-plugin)
+- [捷报频传!Apache APISIX 现已支持对接 Google Cloud
Logging](https://apisix.apache.org/zh/blog/2021/12/22/google-logging)
+- [强强联合!APISIX 集成 SkyWalking
打造全方位日志处理](https://apisix.apache.org/zh/blog/2021/12/07/apisix-integrate-skywalking-plugin)