xianshun163 edited a comment on pull request #6315:
URL: https://github.com/apache/apisix/pull/6315#issuecomment-1067908367
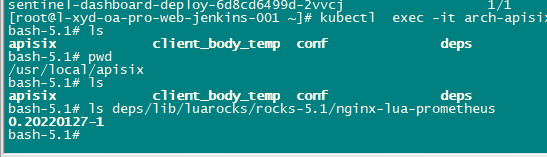
@tzssangglass ,I have updated the version of nginx-lua-prometheus
dependency package. I directly used the new version of dependency package when
packaging with dockerfile.
My version of apifix is 2.11.0.
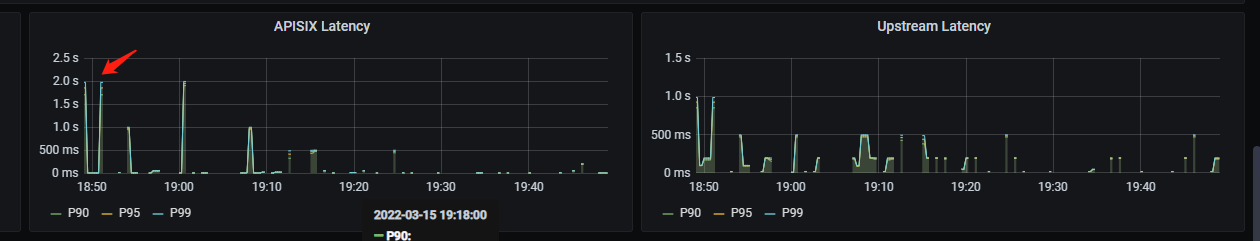
As shown in the figure. I found that the apifix delay on grafana is not
stable, as shown in the figure. At the beginning, it is 190ms, and then it
becomes more than 1s.
And, looking at the graph of grafana, the delay is still relatively large.
I just piloted a few services. The QPS is less than 100, and the CPU
utilization of the gateway is also very low.
the access.log of the nginx print the variable below:
$request_time $upstream_connect_time $upstream_response_time
in the access.log , I can not find the record who has so manay delay
time.
--
This is an automated message from the Apache Git Service.
To respond to the message, please log on to GitHub and use the
URL above to go to the specific comment.
To unsubscribe, e-mail: [email protected]
For queries about this service, please contact Infrastructure at:
[email protected]