hf400159 commented on code in PR #1046:
URL: https://github.com/apache/apisix-website/pull/1046#discussion_r854734912
########## website/blog/2022/04/17/md.md: ########## @@ -0,0 +1,313 @@ +--- +title: "API Observability with Apache APISIX Plugins" +keywords: +- Apache APISIX +description: In this blog post, we can leverage the power of some [Apache APISIX ](https://apisix.apache.org/)Observability Plugins and take a look at how to set up these plugins, how to use them to understand API behavior, and later solve problems that impact our users. +tags: [Events] +--- + +> In this blog post, we can leverage the power of some [Apache APISIX](https://apisix.apache.org/)Observability Plugins and take a look at how to set up these plugins, how to use them to understand API behavior, and later solve problems that impact our users. + +<!--truncate--> + +  + + [#api](https://dev.to/t/api) [#plugins](https://dev.to/t/plugins) [#monitoring](https://dev.to/t/monitoring) [#opensource](https://dev.to/t/opensource) + +In this blog post, we can leverage the power of some [Apache APISIX](https://apisix.apache.org/)Observability Plugins and take a look at how to set up these plugins, how to use them to understand API behavior, and later solve problems that impact our users. Review Comment: ```suggestion In this blog post, we can leverage the power of some [Apache APISIX](https://apisix.apache.org/) Observability Plugins and take a look at how to set up these plugins, how to use them to understand API behavior, and later solve problems that impact our users. ``` ########## website/blog/2022/04/17/md.md: ########## @@ -0,0 +1,313 @@ +--- +title: "API Observability with Apache APISIX Plugins" +keywords: +- Apache APISIX +description: In this blog post, we can leverage the power of some [Apache APISIX ](https://apisix.apache.org/)Observability Plugins and take a look at how to set up these plugins, how to use them to understand API behavior, and later solve problems that impact our users. +tags: [Events] +--- + +> In this blog post, we can leverage the power of some [Apache APISIX](https://apisix.apache.org/)Observability Plugins and take a look at how to set up these plugins, how to use them to understand API behavior, and later solve problems that impact our users. + +<!--truncate--> + +  + + [#api](https://dev.to/t/api) [#plugins](https://dev.to/t/plugins) [#monitoring](https://dev.to/t/monitoring) [#opensource](https://dev.to/t/opensource) + +In this blog post, we can leverage the power of some [Apache APISIX](https://apisix.apache.org/)Observability Plugins and take a look at how to set up these plugins, how to use them to understand API behavior, and later solve problems that impact our users. + +## APIs are everywhere + +APIs — by now, we're all familiar with the term. Every service we use today either uses an API or is an API itself. APIs are central in building and delivering your services. Also, you know that the success of your services depends on the integrity, availability, and performance of your APIs. + +Nowadays **API Observability** is already a part of every API development as it addresses many problems related to API consistency, reliability, and the ability to quickly iterate on new API features. When you design for full-stack observability, you get everything you need to find issues and catch breaking changes. + +API observability can help every team in your organization: + +* Sales and growth teams to monitor your API usage, free trials, observe expansion opportunities and ensure that API serves the correct data. + +* Engineering teams to monitor and troubleshoot API issues. + +* Product teams to understand API usage and business value. + +* Security teams to detect and protect from API threats. + +[](https://res.cloudinary.com/practicaldev/image/fetch/s--ItJyrD63--/c_limit%2Cf_auto%2Cfl_progressive%2Cq_auto%2Cw_880/https://dev-to-uploads.s3.amazonaws.com/uploads/articles/h9jrwx2p2zx7nj6a4ixj.jpg) + +## A central point for observation + +We know that an API gateway offers a central control point for incoming traffic to a variety of destinations but it can also be a central point for observation as well since it is uniquely qualified to know about all the traffic moving between clients and our service networks. Instead of spending time integrating your services with other many APIs and technologies to improve observability, you can easily manage all work with [Apache APISIX Plugins](https://apisix.apache.org/plugins). + +[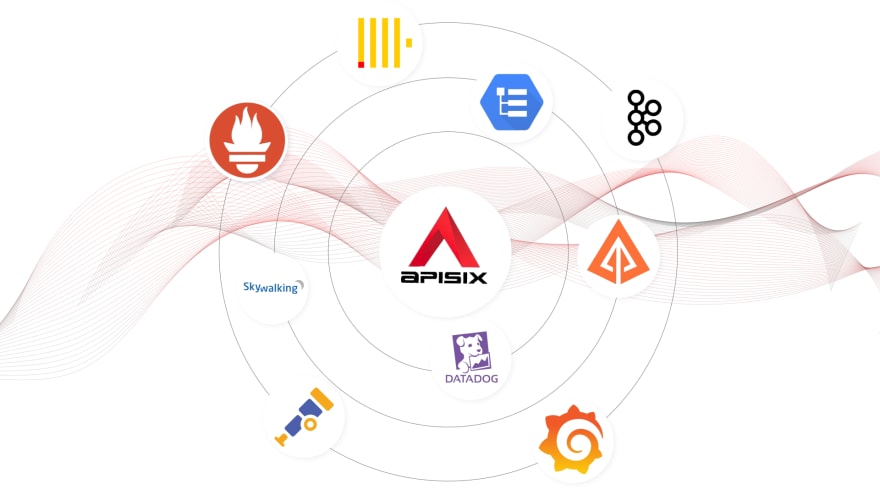](https://res.cloudinary.com/practicaldev/image/fetch/s--VsqAUhDr--/c_limit%2Cf_auto%2Cfl_progressive%2Cq_auto%2Cw_880/https://dev-to-uploads.s3.amazonaws.com/uploads/articles/tnfl87lnii0x93qyy30n.jpg) + +Most observability platforms like (Prometheus, Skywalking, and Opentelemetry) provide pre-built connectors that you can easily integrate with Apache APISIX. You can leverage these connectors to ingest log data from your API gateways to further derive useful metrics and gain complete visibility into the usage, manage performance, and security of your APIs in your environment. Review Comment: ```suggestion Most observability platforms like (Prometheus, SkyWalking, and Opentelemetry) provide pre-built connectors that you can easily integrate with Apache APISIX. You can leverage these connectors to ingest log data from your API gateways to further derive useful metrics and gain complete visibility into the usage, management performance, and security of your APIs in your environment. ``` ########## website/blog/2022/04/17/md.md: ########## @@ -0,0 +1,313 @@ +--- +title: "API Observability with Apache APISIX Plugins" +keywords: +- Apache APISIX +description: In this blog post, we can leverage the power of some [Apache APISIX ](https://apisix.apache.org/)Observability Plugins and take a look at how to set up these plugins, how to use them to understand API behavior, and later solve problems that impact our users. +tags: [Events] +--- + +> In this blog post, we can leverage the power of some [Apache APISIX](https://apisix.apache.org/)Observability Plugins and take a look at how to set up these plugins, how to use them to understand API behavior, and later solve problems that impact our users. + +<!--truncate--> + +  + + [#api](https://dev.to/t/api) [#plugins](https://dev.to/t/plugins) [#monitoring](https://dev.to/t/monitoring) [#opensource](https://dev.to/t/opensource) + +In this blog post, we can leverage the power of some [Apache APISIX](https://apisix.apache.org/)Observability Plugins and take a look at how to set up these plugins, how to use them to understand API behavior, and later solve problems that impact our users. + +## APIs are everywhere + +APIs — by now, we're all familiar with the term. Every service we use today either uses an API or is an API itself. APIs are central in building and delivering your services. Also, you know that the success of your services depends on the integrity, availability, and performance of your APIs. + +Nowadays **API Observability** is already a part of every API development as it addresses many problems related to API consistency, reliability, and the ability to quickly iterate on new API features. When you design for full-stack observability, you get everything you need to find issues and catch breaking changes. + +API observability can help every team in your organization: + +* Sales and growth teams to monitor your API usage, free trials, observe expansion opportunities and ensure that API serves the correct data. + +* Engineering teams to monitor and troubleshoot API issues. + +* Product teams to understand API usage and business value. + +* Security teams to detect and protect from API threats. + +[](https://res.cloudinary.com/practicaldev/image/fetch/s--ItJyrD63--/c_limit%2Cf_auto%2Cfl_progressive%2Cq_auto%2Cw_880/https://dev-to-uploads.s3.amazonaws.com/uploads/articles/h9jrwx2p2zx7nj6a4ixj.jpg) + +## A central point for observation + +We know that an API gateway offers a central control point for incoming traffic to a variety of destinations but it can also be a central point for observation as well since it is uniquely qualified to know about all the traffic moving between clients and our service networks. Instead of spending time integrating your services with other many APIs and technologies to improve observability, you can easily manage all work with [Apache APISIX Plugins](https://apisix.apache.org/plugins). + +[](https://res.cloudinary.com/practicaldev/image/fetch/s--VsqAUhDr--/c_limit%2Cf_auto%2Cfl_progressive%2Cq_auto%2Cw_880/https://dev-to-uploads.s3.amazonaws.com/uploads/articles/tnfl87lnii0x93qyy30n.jpg) + +Most observability platforms like (Prometheus, Skywalking, and Opentelemetry) provide pre-built connectors that you can easily integrate with Apache APISIX. You can leverage these connectors to ingest log data from your API gateways to further derive useful metrics and gain complete visibility into the usage, manage performance, and security of your APIs in your environment. + +The core of observability breaks down into _three key areas_: structured logs, metrics, and traces. Let’s break down each pillar of API observability and learn how with Apache APISIX Plugins we can simplify these tasks and provides a solution that you can use to better understand API usage. + +[](https://res.cloudinary.com/practicaldev/image/fetch/s--B3oq78c6--/c_limit%2Cf_auto%2Cfl_progressive%2Cq_auto%2Cw_880/https://dev-to-uploads.s3.amazonaws.com/uploads/articles/a7arrpcc7j95auh7gi2u.jpg) + +* * * + +## Prerequisites + +Before enabling our plugins we need to install Apache APISIX, create a route, an upstream, and map the route to the upstream. You can simply follow [getting started guide](https://apisix.apache.org/docs/apisix/getting-started) provided on the website. + +## Logs + +**Logs** are also easy to instrument and trivial steps of API observability, they can be used to inspect API calls in real-time for debugging, auditing, and recording time-stamped events that happened over time. There are several logger plugins Apache APISIX provides such as: + +* [http-logger](https://apisix.apache.org/docs/apisix/plugins/http-logger/) + +* [skywalking-logger](https://apisix.apache.org/docs/apisix/plugins/skywalking-logger/) + +* [tcp-logger](https://apisix.apache.org/docs/apisix/plugins/tcp-logger) + +* [kafka-logger](https://apisix.apache.org/docs/apisix/plugins/kafka-logger) + +* [rocketmq-logger](https://apisix.apache.org/docs/apisix/plugins/rocketmq-logger) + +* [udp-logger](https://apisix.apache.org/docs/apisix/plugins/udp-logger) + +* [clickhouse-logger](https://apisix.apache.org/docs/apisix/plugins/clickhouse-logger) + +* [error-logger](https://apisix.apache.org/docs/apisix/plugins/error-log-logger) + +* [google-cloud-logging](https://apisix.apache.org/docs/apisix/plugins/google-cloud-logging) + +And you can see the [full list](https://apisix.apache.org/docs/apisix/plugins/zipkin) on the official website of Apache APISIX. Now for demo purposes, let's choose a simple but mostly used _http-logger_ plugin that is capable of sending API Log data requests to HTTP/HTTPS servers or sends as JSON objects to Monitoring tools. We can assume that a route and an upstream are created. You can learn how to set up them in the **[Getting started with Apache APISIX](https://youtu.be/dUOjJkb61so)** video tutorial. Also, you can find all command-line examples on the GitHub page [apisix-observability-plugins](https://boburmirzo.github.io/apisix-observability-plugins/) + +You can generate a mock HTTP server at [mockbin.com](https://mockbin.org/) to record and view the logs. Note that we also bind the route to an upstream (You can refer to this documentation to learn about more [core concepts of Apache APISIX](https://apisix.apache.org/docs/apisix/architecture-design/apisix)). + +The following is an example of how to enable the http-logger for a specific route. + +``` + + curl http://127.0.0.1:9080/apisix/admin/routes/1 -H 'X-API-KEY: edd1c9f034335f136f87ad84b625c8f1' -X PUT -d ' + +{ + + "plugins": { + + "http-logger": { + + "uri": "http://mockbin.org/bin/5451b7cd-af27-41b8-8df1-282ffea13a61"; + + } + + }, + + "upstream_id": "1", + + "uri": "/get" + +}' + +``` + +> To http-logger plugin settings, your can just put your mock server URI address like below: + +``` + + {"uri": "http://mockbin.org/bin/5451b7cd-af27-41b8-8df1-282ffea13a61"} + + + +Once we get a successful response from APISIX server, we can send a request to this _get_ endpoint to generate logs. + + + + curl -i http://127.0.0.1:9080/get + + +``` + +Then if you click and navigate to the following our [mock server link](http://mockbin.org/bin/5451b7cd-af27-41b8-8df1-282ffea13a61/log) some recent logs are sent and we can see them: + +[](https://res.cloudinary.com/practicaldev/image/fetch/s--QKKMcTzR--/c_limit%2Cf_auto%2Cfl_progressive%2Cq_auto%2Cw_880/https://dev-to-uploads.s3.amazonaws.com/uploads/articles/ebxeqowkc2whmyzx8zsk.png) + +## Metrics + +**Metrics** are a numeric representation of data measured over intervals of time. You can also aggregate this data into daily or weekly frequency and run queries against a distributed system like [Elasticsearch](https://www.elastic.co/). Or sometimes based on metrics you trigger alerts to take any action later. Once API metrics are collected, you can track them with metrics tracking tools such as [Prometheus](https://prometheus.io/). + +Apache APISIX API Gateway also offers [prometheus-plugin](https://apisix.apache.org/docs/apisix/plugins/prometheus/) to fetch your API metrics and expose them in Prometheus. Behind the scene, Apache APISIX downloads the Grafana dashboard meta, imports it to [Grafana](https://grafana.com/), and fetches real-time metrics from the Prometheus plugin. + +Let’s enable prometheus-plugin for our route: + +``` + curl http://127.0.0.1:9080/apisix/admin/routes/1 -H 'X-API-KEY: edd1c9f034335f136f87ad84b625c8f1' -X PUT -d ' + +{ + + "uri": "/get", + + "plugins": { + + "prometheus":{} + + }, + + "upstream_id": "1" + +}' + + +``` + +We fetch the metric data from the specified URL `/apisix/prometheus/`metrics. + +``` + curl -i http://127.0.0.1:9091/apisix/prometheus/metrics + +``` + +You will get a response with Prometheus metrics something like below: + +``` + HTTP/1.1 200 OK + + Server: openresty + + Date: Fri, 25 Mar 2022 11:13:14 GMT + + Content-Type: text/plain; charset=utf-8 + + Transfer-Encoding: chunked + + Connection: keep-alive + + # HELP apisix_batch_process_entries batch process remaining entries + + # TYPE apisix_batch_process_entries gauge + + apisix_batch_process_entries{name="http logger",route_id="1",server_addr="172.19.0.8"} 0 + + # HELP apisix_etcd_modify_indexes Etcd modify index for APISIX keys + + # TYPE apisix_etcd_modify_indexes gauge + + apisix_etcd_modify_indexes{key="consumers"} 17819 + + apisix_etcd_modify_indexes{key="global_rules"} 17832 + + apisix_etcd_modify_indexes{key="max_modify_index"} 20028 + + apisix_etcd_modify_indexes{key="prev_index"} 18963 + + apisix_etcd_modify_indexes{key="protos"} 0 + + apisix_etcd_modify_indexes{key="routes"} 20028 + + ... + +``` + +And we can also check the status of our endpoint at the Prometheus dashboard by pointing to this URL `http://localhost:9090/targets` + +[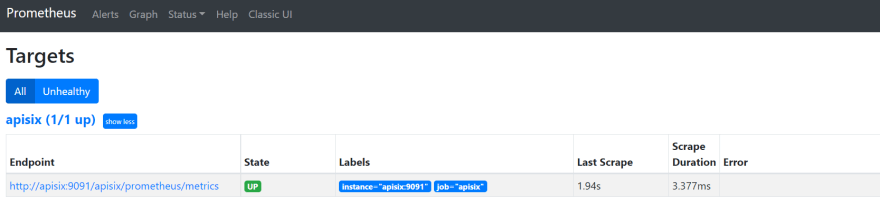](https://res.cloudinary.com/practicaldev/image/fetch/s--3oVnBx6W--/c_limit%2Cf_auto%2Cfl_progressive%2Cq_auto%2Cw_880/https://dev-to-uploads.s3.amazonaws.com/uploads/articles/jg8mlc7tifrduomwp5vj.png) + +As you can see, Apache APISIX exposed metrics endpoint is upon and running. + +Now you can query metrics for `apisix_http_status` to see what HTTP requests are handled by API Gateway and what was the outcome. + +[](https://res.cloudinary.com/practicaldev/image/fetch/s--t7CroAIQ--/c_limit%2Cf_auto%2Cfl_progressive%2Cq_auto%2Cw_880/https://dev-to-uploads.s3.amazonaws.com/uploads/articles/36qcbqggieet4wms0ivu.png) + +[](https://res.cloudinary.com/practicaldev/image/fetch/s--owBpTjKI--/c_limit%2Cf_auto%2Cfl_progressive%2Cq_auto%2Cw_880/https://dev-to-uploads.s3.amazonaws.com/uploads/articles/d7jyr8xo5uny70vcb4rd.png) + +In addition to this, you can view the Grafana dashboard running in your local instance. Go to `http://localhost:3000/` + +[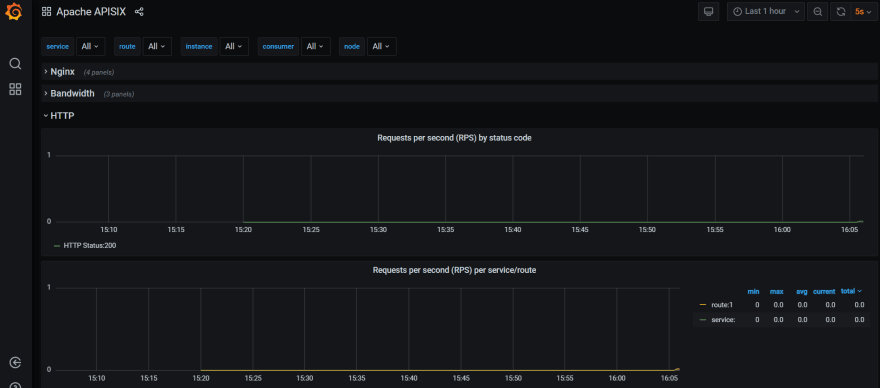](https://res.cloudinary.com/practicaldev/image/fetch/s--4-6fmBbW--/c_limit%2Cf_auto%2Cfl_progressive%2Cq_auto%2Cw_880/https://dev-to-uploads.s3.amazonaws.com/uploads/articles/mdpwdm84lqmbd9cyytt0.png) + +You can also check two other plugins for metrics: Review Comment: Here are two Tracers links? `skywalking` and `opentelemetry` only be used by Tracers. I think it should be `prometheus` here. ########## website/blog/2022/04/17/md.md: ########## @@ -0,0 +1,313 @@ +--- +title: "API Observability with Apache APISIX Plugins" +keywords: +- Apache APISIX +description: In this blog post, we can leverage the power of some [Apache APISIX ](https://apisix.apache.org/)Observability Plugins and take a look at how to set up these plugins, how to use them to understand API behavior, and later solve problems that impact our users. +tags: [Events] +--- + +> In this blog post, we can leverage the power of some [Apache APISIX](https://apisix.apache.org/)Observability Plugins and take a look at how to set up these plugins, how to use them to understand API behavior, and later solve problems that impact our users. Review Comment: ```suggestion > In this blog post, we can leverage the power of some [Apache APISIX](https://apisix.apache.org/) Observability Plugins and take a look at how to set up these plugins, how to use them to understand API behavior, and later solve problems that impact APISIX's users. ``` ########## website/blog/2022/04/17/md.md: ########## @@ -0,0 +1,313 @@ +--- +title: "API Observability with Apache APISIX Plugins" +keywords: +- Apache APISIX +description: In this blog post, we can leverage the power of some [Apache APISIX ](https://apisix.apache.org/)Observability Plugins and take a look at how to set up these plugins, how to use them to understand API behavior, and later solve problems that impact our users. +tags: [Events] +--- + +> In this blog post, we can leverage the power of some [Apache APISIX](https://apisix.apache.org/)Observability Plugins and take a look at how to set up these plugins, how to use them to understand API behavior, and later solve problems that impact our users. + +<!--truncate--> + +  + + [#api](https://dev.to/t/api) [#plugins](https://dev.to/t/plugins) [#monitoring](https://dev.to/t/monitoring) [#opensource](https://dev.to/t/opensource) + +In this blog post, we can leverage the power of some [Apache APISIX](https://apisix.apache.org/)Observability Plugins and take a look at how to set up these plugins, how to use them to understand API behavior, and later solve problems that impact our users. + +## APIs are everywhere + +APIs — by now, we're all familiar with the term. Every service we use today either uses an API or is an API itself. APIs are central in building and delivering your services. Also, you know that the success of your services depends on the integrity, availability, and performance of your APIs. + +Nowadays **API Observability** is already a part of every API development as it addresses many problems related to API consistency, reliability, and the ability to quickly iterate on new API features. When you design for full-stack observability, you get everything you need to find issues and catch breaking changes. + +API observability can help every team in your organization: + +* Sales and growth teams to monitor your API usage, free trials, observe expansion opportunities and ensure that API serves the correct data. + +* Engineering teams to monitor and troubleshoot API issues. + +* Product teams to understand API usage and business value. + +* Security teams to detect and protect from API threats. + +[](https://res.cloudinary.com/practicaldev/image/fetch/s--ItJyrD63--/c_limit%2Cf_auto%2Cfl_progressive%2Cq_auto%2Cw_880/https://dev-to-uploads.s3.amazonaws.com/uploads/articles/h9jrwx2p2zx7nj6a4ixj.jpg) + +## A central point for observation + +We know that an API gateway offers a central control point for incoming traffic to a variety of destinations but it can also be a central point for observation as well since it is uniquely qualified to know about all the traffic moving between clients and our service networks. Instead of spending time integrating your services with other many APIs and technologies to improve observability, you can easily manage all work with [Apache APISIX Plugins](https://apisix.apache.org/plugins). + +[](https://res.cloudinary.com/practicaldev/image/fetch/s--VsqAUhDr--/c_limit%2Cf_auto%2Cfl_progressive%2Cq_auto%2Cw_880/https://dev-to-uploads.s3.amazonaws.com/uploads/articles/tnfl87lnii0x93qyy30n.jpg) + +Most observability platforms like (Prometheus, Skywalking, and Opentelemetry) provide pre-built connectors that you can easily integrate with Apache APISIX. You can leverage these connectors to ingest log data from your API gateways to further derive useful metrics and gain complete visibility into the usage, manage performance, and security of your APIs in your environment. + +The core of observability breaks down into _three key areas_: structured logs, metrics, and traces. Let’s break down each pillar of API observability and learn how with Apache APISIX Plugins we can simplify these tasks and provides a solution that you can use to better understand API usage. + +[](https://res.cloudinary.com/practicaldev/image/fetch/s--B3oq78c6--/c_limit%2Cf_auto%2Cfl_progressive%2Cq_auto%2Cw_880/https://dev-to-uploads.s3.amazonaws.com/uploads/articles/a7arrpcc7j95auh7gi2u.jpg) + +* * * + +## Prerequisites + +Before enabling our plugins we need to install Apache APISIX, create a route, an upstream, and map the route to the upstream. You can simply follow [getting started guide](https://apisix.apache.org/docs/apisix/getting-started) provided on the website. + +## Logs + +**Logs** are also easy to instrument and trivial steps of API observability, they can be used to inspect API calls in real-time for debugging, auditing, and recording time-stamped events that happened over time. There are several logger plugins Apache APISIX provides such as: + +* [http-logger](https://apisix.apache.org/docs/apisix/plugins/http-logger/) + +* [skywalking-logger](https://apisix.apache.org/docs/apisix/plugins/skywalking-logger/) + +* [tcp-logger](https://apisix.apache.org/docs/apisix/plugins/tcp-logger) + +* [kafka-logger](https://apisix.apache.org/docs/apisix/plugins/kafka-logger) + +* [rocketmq-logger](https://apisix.apache.org/docs/apisix/plugins/rocketmq-logger) + +* [udp-logger](https://apisix.apache.org/docs/apisix/plugins/udp-logger) + +* [clickhouse-logger](https://apisix.apache.org/docs/apisix/plugins/clickhouse-logger) + +* [error-logger](https://apisix.apache.org/docs/apisix/plugins/error-log-logger) + +* [google-cloud-logging](https://apisix.apache.org/docs/apisix/plugins/google-cloud-logging) + +And you can see the [full list](https://apisix.apache.org/docs/apisix/plugins/zipkin) on the official website of Apache APISIX. Now for demo purposes, let's choose a simple but mostly used _http-logger_ plugin that is capable of sending API Log data requests to HTTP/HTTPS servers or sends as JSON objects to Monitoring tools. We can assume that a route and an upstream are created. You can learn how to set up them in the **[Getting started with Apache APISIX](https://youtu.be/dUOjJkb61so)** video tutorial. Also, you can find all command-line examples on the GitHub page [apisix-observability-plugins](https://boburmirzo.github.io/apisix-observability-plugins/) Review Comment: ```suggestion And you can see the [full list](https://apisix.apache.org/docs/apisix/plugins/zipkin) on the official website of Apache APISIX. Now for demo purposes, let's choose a simple but mostly used _http-logger_ plugin that is capable of sending API Log data requests to HTTP/HTTPS servers or sends as JSON objects to Monitoring tools. We can assume that a route and an upstream are created. You can learn how to set up them in the **[Getting started with Apache APISIX](https://youtu.be/dUOjJkb61so)** video tutorial. Also, you can find all command-line examples on the GitHub page [apisix-observability-plugins](https://boburmirzo.github.io/apisix-observability-plugins/). ``` ########## website/blog/2022/04/17/md.md: ########## @@ -0,0 +1,313 @@ +--- +title: "API Observability with Apache APISIX Plugins" +keywords: +- Apache APISIX +description: In this blog post, we can leverage the power of some [Apache APISIX ](https://apisix.apache.org/)Observability Plugins and take a look at how to set up these plugins, how to use them to understand API behavior, and later solve problems that impact our users. +tags: [Events] +--- + +> In this blog post, we can leverage the power of some [Apache APISIX](https://apisix.apache.org/)Observability Plugins and take a look at how to set up these plugins, how to use them to understand API behavior, and later solve problems that impact our users. + +<!--truncate--> + +  + + [#api](https://dev.to/t/api) [#plugins](https://dev.to/t/plugins) [#monitoring](https://dev.to/t/monitoring) [#opensource](https://dev.to/t/opensource) + +In this blog post, we can leverage the power of some [Apache APISIX](https://apisix.apache.org/)Observability Plugins and take a look at how to set up these plugins, how to use them to understand API behavior, and later solve problems that impact our users. + +## APIs are everywhere + +APIs — by now, we're all familiar with the term. Every service we use today either uses an API or is an API itself. APIs are central in building and delivering your services. Also, you know that the success of your services depends on the integrity, availability, and performance of your APIs. + +Nowadays **API Observability** is already a part of every API development as it addresses many problems related to API consistency, reliability, and the ability to quickly iterate on new API features. When you design for full-stack observability, you get everything you need to find issues and catch breaking changes. + +API observability can help every team in your organization: + +* Sales and growth teams to monitor your API usage, free trials, observe expansion opportunities and ensure that API serves the correct data. + +* Engineering teams to monitor and troubleshoot API issues. + +* Product teams to understand API usage and business value. + +* Security teams to detect and protect from API threats. + +[](https://res.cloudinary.com/practicaldev/image/fetch/s--ItJyrD63--/c_limit%2Cf_auto%2Cfl_progressive%2Cq_auto%2Cw_880/https://dev-to-uploads.s3.amazonaws.com/uploads/articles/h9jrwx2p2zx7nj6a4ixj.jpg) + +## A central point for observation + +We know that an API gateway offers a central control point for incoming traffic to a variety of destinations but it can also be a central point for observation as well since it is uniquely qualified to know about all the traffic moving between clients and our service networks. Instead of spending time integrating your services with other many APIs and technologies to improve observability, you can easily manage all work with [Apache APISIX Plugins](https://apisix.apache.org/plugins). + +[](https://res.cloudinary.com/practicaldev/image/fetch/s--VsqAUhDr--/c_limit%2Cf_auto%2Cfl_progressive%2Cq_auto%2Cw_880/https://dev-to-uploads.s3.amazonaws.com/uploads/articles/tnfl87lnii0x93qyy30n.jpg) + +Most observability platforms like (Prometheus, Skywalking, and Opentelemetry) provide pre-built connectors that you can easily integrate with Apache APISIX. You can leverage these connectors to ingest log data from your API gateways to further derive useful metrics and gain complete visibility into the usage, manage performance, and security of your APIs in your environment. + +The core of observability breaks down into _three key areas_: structured logs, metrics, and traces. Let’s break down each pillar of API observability and learn how with Apache APISIX Plugins we can simplify these tasks and provides a solution that you can use to better understand API usage. Review Comment: ```suggestion The core of observability breaks down into **three key areas**: structured logs, metrics, and traces. Let’s break down each pillar of API observability and learn how with Apache APISIX Plugins we can simplify these tasks and provides a solution that you can use to better understand API usage. ``` ########## website/blog/2022/04/17/md.md: ########## @@ -0,0 +1,313 @@ +--- +title: "API Observability with Apache APISIX Plugins" +keywords: +- Apache APISIX +description: In this blog post, we can leverage the power of some [Apache APISIX ](https://apisix.apache.org/)Observability Plugins and take a look at how to set up these plugins, how to use them to understand API behavior, and later solve problems that impact our users. +tags: [Events] +--- + +> In this blog post, we can leverage the power of some [Apache APISIX](https://apisix.apache.org/)Observability Plugins and take a look at how to set up these plugins, how to use them to understand API behavior, and later solve problems that impact our users. + +<!--truncate--> + +  + + [#api](https://dev.to/t/api) [#plugins](https://dev.to/t/plugins) [#monitoring](https://dev.to/t/monitoring) [#opensource](https://dev.to/t/opensource) + +In this blog post, we can leverage the power of some [Apache APISIX](https://apisix.apache.org/)Observability Plugins and take a look at how to set up these plugins, how to use them to understand API behavior, and later solve problems that impact our users. + +## APIs are everywhere + +APIs — by now, we're all familiar with the term. Every service we use today either uses an API or is an API itself. APIs are central in building and delivering your services. Also, you know that the success of your services depends on the integrity, availability, and performance of your APIs. + +Nowadays **API Observability** is already a part of every API development as it addresses many problems related to API consistency, reliability, and the ability to quickly iterate on new API features. When you design for full-stack observability, you get everything you need to find issues and catch breaking changes. + +API observability can help every team in your organization: + +* Sales and growth teams to monitor your API usage, free trials, observe expansion opportunities and ensure that API serves the correct data. + +* Engineering teams to monitor and troubleshoot API issues. + +* Product teams to understand API usage and business value. + +* Security teams to detect and protect from API threats. + +[](https://res.cloudinary.com/practicaldev/image/fetch/s--ItJyrD63--/c_limit%2Cf_auto%2Cfl_progressive%2Cq_auto%2Cw_880/https://dev-to-uploads.s3.amazonaws.com/uploads/articles/h9jrwx2p2zx7nj6a4ixj.jpg) + +## A central point for observation + +We know that an API gateway offers a central control point for incoming traffic to a variety of destinations but it can also be a central point for observation as well since it is uniquely qualified to know about all the traffic moving between clients and our service networks. Instead of spending time integrating your services with other many APIs and technologies to improve observability, you can easily manage all work with [Apache APISIX Plugins](https://apisix.apache.org/plugins). + +[](https://res.cloudinary.com/practicaldev/image/fetch/s--VsqAUhDr--/c_limit%2Cf_auto%2Cfl_progressive%2Cq_auto%2Cw_880/https://dev-to-uploads.s3.amazonaws.com/uploads/articles/tnfl87lnii0x93qyy30n.jpg) + +Most observability platforms like (Prometheus, Skywalking, and Opentelemetry) provide pre-built connectors that you can easily integrate with Apache APISIX. You can leverage these connectors to ingest log data from your API gateways to further derive useful metrics and gain complete visibility into the usage, manage performance, and security of your APIs in your environment. + +The core of observability breaks down into _three key areas_: structured logs, metrics, and traces. Let’s break down each pillar of API observability and learn how with Apache APISIX Plugins we can simplify these tasks and provides a solution that you can use to better understand API usage. + +[](https://res.cloudinary.com/practicaldev/image/fetch/s--B3oq78c6--/c_limit%2Cf_auto%2Cfl_progressive%2Cq_auto%2Cw_880/https://dev-to-uploads.s3.amazonaws.com/uploads/articles/a7arrpcc7j95auh7gi2u.jpg) + +* * * + +## Prerequisites + +Before enabling our plugins we need to install Apache APISIX, create a route, an upstream, and map the route to the upstream. You can simply follow [getting started guide](https://apisix.apache.org/docs/apisix/getting-started) provided on the website. + +## Logs + +**Logs** are also easy to instrument and trivial steps of API observability, they can be used to inspect API calls in real-time for debugging, auditing, and recording time-stamped events that happened over time. There are several logger plugins Apache APISIX provides such as: + +* [http-logger](https://apisix.apache.org/docs/apisix/plugins/http-logger/) + +* [skywalking-logger](https://apisix.apache.org/docs/apisix/plugins/skywalking-logger/) + +* [tcp-logger](https://apisix.apache.org/docs/apisix/plugins/tcp-logger) + +* [kafka-logger](https://apisix.apache.org/docs/apisix/plugins/kafka-logger) + +* [rocketmq-logger](https://apisix.apache.org/docs/apisix/plugins/rocketmq-logger) + +* [udp-logger](https://apisix.apache.org/docs/apisix/plugins/udp-logger) + +* [clickhouse-logger](https://apisix.apache.org/docs/apisix/plugins/clickhouse-logger) + +* [error-logger](https://apisix.apache.org/docs/apisix/plugins/error-log-logger) + +* [google-cloud-logging](https://apisix.apache.org/docs/apisix/plugins/google-cloud-logging) + +And you can see the [full list](https://apisix.apache.org/docs/apisix/plugins/zipkin) on the official website of Apache APISIX. Now for demo purposes, let's choose a simple but mostly used _http-logger_ plugin that is capable of sending API Log data requests to HTTP/HTTPS servers or sends as JSON objects to Monitoring tools. We can assume that a route and an upstream are created. You can learn how to set up them in the **[Getting started with Apache APISIX](https://youtu.be/dUOjJkb61so)** video tutorial. Also, you can find all command-line examples on the GitHub page [apisix-observability-plugins](https://boburmirzo.github.io/apisix-observability-plugins/) + +You can generate a mock HTTP server at [mockbin.com](https://mockbin.org/) to record and view the logs. Note that we also bind the route to an upstream (You can refer to this documentation to learn about more [core concepts of Apache APISIX](https://apisix.apache.org/docs/apisix/architecture-design/apisix)). + +The following is an example of how to enable the http-logger for a specific route. + +``` + + curl http://127.0.0.1:9080/apisix/admin/routes/1 -H 'X-API-KEY: edd1c9f034335f136f87ad84b625c8f1' -X PUT -d ' + +{ + + "plugins": { + + "http-logger": { + + "uri": "http://mockbin.org/bin/5451b7cd-af27-41b8-8df1-282ffea13a61"; + + } + + }, + + "upstream_id": "1", + + "uri": "/get" + +}' + Review Comment: ```suggestion curl http://127.0.0.1:9080/apisix/admin/routes/1 \ -H 'X-API-KEY: edd1c9f034335f136f87ad84b625c8f1' -X PUT -d ' { "plugins": { "http-logger": { "uri": "http://mockbin.org/bin/5451b7cd-af27-41b8-8df1-282ffea13a61"; } }, "upstream_id": "1", "uri": "/get" }' ``` ########## website/blog/2022/04/17/md.md: ########## @@ -0,0 +1,313 @@ +--- +title: "API Observability with Apache APISIX Plugins" +keywords: +- Apache APISIX +description: In this blog post, we can leverage the power of some [Apache APISIX ](https://apisix.apache.org/)Observability Plugins and take a look at how to set up these plugins, how to use them to understand API behavior, and later solve problems that impact our users. +tags: [Events] +--- + +> In this blog post, we can leverage the power of some [Apache APISIX](https://apisix.apache.org/)Observability Plugins and take a look at how to set up these plugins, how to use them to understand API behavior, and later solve problems that impact our users. + +<!--truncate--> + +  + + [#api](https://dev.to/t/api) [#plugins](https://dev.to/t/plugins) [#monitoring](https://dev.to/t/monitoring) [#opensource](https://dev.to/t/opensource) + +In this blog post, we can leverage the power of some [Apache APISIX](https://apisix.apache.org/)Observability Plugins and take a look at how to set up these plugins, how to use them to understand API behavior, and later solve problems that impact our users. + +## APIs are everywhere + +APIs — by now, we're all familiar with the term. Every service we use today either uses an API or is an API itself. APIs are central in building and delivering your services. Also, you know that the success of your services depends on the integrity, availability, and performance of your APIs. + +Nowadays **API Observability** is already a part of every API development as it addresses many problems related to API consistency, reliability, and the ability to quickly iterate on new API features. When you design for full-stack observability, you get everything you need to find issues and catch breaking changes. + +API observability can help every team in your organization: + +* Sales and growth teams to monitor your API usage, free trials, observe expansion opportunities and ensure that API serves the correct data. + +* Engineering teams to monitor and troubleshoot API issues. + +* Product teams to understand API usage and business value. + +* Security teams to detect and protect from API threats. + +[](https://res.cloudinary.com/practicaldev/image/fetch/s--ItJyrD63--/c_limit%2Cf_auto%2Cfl_progressive%2Cq_auto%2Cw_880/https://dev-to-uploads.s3.amazonaws.com/uploads/articles/h9jrwx2p2zx7nj6a4ixj.jpg) + +## A central point for observation + +We know that an API gateway offers a central control point for incoming traffic to a variety of destinations but it can also be a central point for observation as well since it is uniquely qualified to know about all the traffic moving between clients and our service networks. Instead of spending time integrating your services with other many APIs and technologies to improve observability, you can easily manage all work with [Apache APISIX Plugins](https://apisix.apache.org/plugins). + +[](https://res.cloudinary.com/practicaldev/image/fetch/s--VsqAUhDr--/c_limit%2Cf_auto%2Cfl_progressive%2Cq_auto%2Cw_880/https://dev-to-uploads.s3.amazonaws.com/uploads/articles/tnfl87lnii0x93qyy30n.jpg) + +Most observability platforms like (Prometheus, Skywalking, and Opentelemetry) provide pre-built connectors that you can easily integrate with Apache APISIX. You can leverage these connectors to ingest log data from your API gateways to further derive useful metrics and gain complete visibility into the usage, manage performance, and security of your APIs in your environment. + +The core of observability breaks down into _three key areas_: structured logs, metrics, and traces. Let’s break down each pillar of API observability and learn how with Apache APISIX Plugins we can simplify these tasks and provides a solution that you can use to better understand API usage. + +[](https://res.cloudinary.com/practicaldev/image/fetch/s--B3oq78c6--/c_limit%2Cf_auto%2Cfl_progressive%2Cq_auto%2Cw_880/https://dev-to-uploads.s3.amazonaws.com/uploads/articles/a7arrpcc7j95auh7gi2u.jpg) + +* * * + +## Prerequisites + +Before enabling our plugins we need to install Apache APISIX, create a route, an upstream, and map the route to the upstream. You can simply follow [getting started guide](https://apisix.apache.org/docs/apisix/getting-started) provided on the website. + +## Logs + +**Logs** are also easy to instrument and trivial steps of API observability, they can be used to inspect API calls in real-time for debugging, auditing, and recording time-stamped events that happened over time. There are several logger plugins Apache APISIX provides such as: + +* [http-logger](https://apisix.apache.org/docs/apisix/plugins/http-logger/) + +* [skywalking-logger](https://apisix.apache.org/docs/apisix/plugins/skywalking-logger/) + +* [tcp-logger](https://apisix.apache.org/docs/apisix/plugins/tcp-logger) + +* [kafka-logger](https://apisix.apache.org/docs/apisix/plugins/kafka-logger) + +* [rocketmq-logger](https://apisix.apache.org/docs/apisix/plugins/rocketmq-logger) + +* [udp-logger](https://apisix.apache.org/docs/apisix/plugins/udp-logger) + +* [clickhouse-logger](https://apisix.apache.org/docs/apisix/plugins/clickhouse-logger) + +* [error-logger](https://apisix.apache.org/docs/apisix/plugins/error-log-logger) + +* [google-cloud-logging](https://apisix.apache.org/docs/apisix/plugins/google-cloud-logging) + +And you can see the [full list](https://apisix.apache.org/docs/apisix/plugins/zipkin) on the official website of Apache APISIX. Now for demo purposes, let's choose a simple but mostly used _http-logger_ plugin that is capable of sending API Log data requests to HTTP/HTTPS servers or sends as JSON objects to Monitoring tools. We can assume that a route and an upstream are created. You can learn how to set up them in the **[Getting started with Apache APISIX](https://youtu.be/dUOjJkb61so)** video tutorial. Also, you can find all command-line examples on the GitHub page [apisix-observability-plugins](https://boburmirzo.github.io/apisix-observability-plugins/) + +You can generate a mock HTTP server at [mockbin.com](https://mockbin.org/) to record and view the logs. Note that we also bind the route to an upstream (You can refer to this documentation to learn about more [core concepts of Apache APISIX](https://apisix.apache.org/docs/apisix/architecture-design/apisix)). + +The following is an example of how to enable the http-logger for a specific route. + +``` + + curl http://127.0.0.1:9080/apisix/admin/routes/1 -H 'X-API-KEY: edd1c9f034335f136f87ad84b625c8f1' -X PUT -d ' + +{ + + "plugins": { + + "http-logger": { + + "uri": "http://mockbin.org/bin/5451b7cd-af27-41b8-8df1-282ffea13a61"; + + } + + }, + + "upstream_id": "1", + + "uri": "/get" + +}' + +``` + +> To http-logger plugin settings, your can just put your mock server URI address like below: + +``` + + {"uri": "http://mockbin.org/bin/5451b7cd-af27-41b8-8df1-282ffea13a61"} + + + +Once we get a successful response from APISIX server, we can send a request to this _get_ endpoint to generate logs. + + + + curl -i http://127.0.0.1:9080/get + + +``` + +Then if you click and navigate to the following our [mock server link](http://mockbin.org/bin/5451b7cd-af27-41b8-8df1-282ffea13a61/log) some recent logs are sent and we can see them: Review Comment: ```suggestion Then if you click and navigate to the following [mock server link](http://mockbin.org/bin/5451b7cd-af27-41b8-8df1-282ffea13a61/log) some recent logs are sent and we can see them: ``` -- This is an automated message from the Apache Git Service. To respond to the message, please log on to GitHub and use the URL above to go to the specific comment. To unsubscribe, e-mail: notifications-unsubscr...@apisix.apache.org For queries about this service, please contact Infrastructure at: us...@infra.apache.org