This is an automated email from the ASF dual-hosted git repository.

jianglongtao pushed a commit to branch master
in repository https://gitbox.apache.org/repos/asf/shardingsphere.git
The following commit(s) were added to refs/heads/master by this push:
new 1145d3defdb upload 2 article to Blog (#25127)
1145d3defdb is described below
commit 1145d3defdb804260ecfc4c1bd4784228df42b04
Author: FPokerFace <[email protected]>
AuthorDate: Wed Apr 12 10:34:06 2023 +0800
upload 2 article to Blog (#25127)
---
...SQL's_Export,_Import,_and_YAML_Conversion.en.md | 13 +-
...r_Data_Migration,_and_Stronger_Encryption.en.md | 134 +++++++++++++
...rdingSphere-Agent,_Prometheus_and_Grafana.en.md | 223 +++++++++++++++++++++
...er_Data_Migration,_and_Stronger_Encryption1.png | Bin 0 -> 119218 bytes
...er_Data_Migration,_and_Stronger_Encryption2.png | Bin 0 -> 73863 bytes
...er_Data_Migration,_and_Stronger_Encryption3.png | Bin 0 -> 129278 bytes
...er_Data_Migration,_and_Stronger_Encryption4.png | Bin 0 -> 50493 bytes
...ardingSphere-Agent,_Prometheus_and_Grafana1.png | Bin 0 -> 67103 bytes
...ardingSphere-Agent,_Prometheus_and_Grafana2.png | Bin 0 -> 98131 bytes
...ardingSphere-Agent,_Prometheus_and_Grafana3.png | Bin 0 -> 157470 bytes
...ardingSphere-Agent,_Prometheus_and_Grafana4.png | Bin 0 -> 218160 bytes
...ardingSphere-Agent,_Prometheus_and_Grafana5.png | Bin 0 -> 78859 bytes
...ardingSphere-Agent,_Prometheus_and_Grafana6.png | Bin 0 -> 74783 bytes
...ardingSphere-Agent,_Prometheus_and_Grafana7.png | Bin 0 -> 57518 bytes
14 files changed, 362 insertions(+), 8 deletions(-)
diff --git
a/docs/blog/content/material/2023_03_21_Streamlining_Database_Configuration_with_DistSQL's_Export,_Import,_and_YAML_Conversion.en.md
b/docs/blog/content/material/2023_03_21_Streamlining_Database_Configuration_with_DistSQL's_Export,_Import,_and_YAML_Conversion.en.md
index cbb4cb792f3..455a6f49273 100644
---
a/docs/blog/content/material/2023_03_21_Streamlining_Database_Configuration_with_DistSQL's_Export,_Import,_and_YAML_Conversion.en.md
+++
b/docs/blog/content/material/2023_03_21_Streamlining_Database_Configuration_with_DistSQL's_Export,_Import,_and_YAML_Conversion.en.md
@@ -378,11 +378,8 @@ If you have any questions or feedback regarding Apache
ShardingSphere, please do
# References
-```plain-text
-[1] DistSQL Documentation:
https://shardingsphere.apache.org/document/5.3.1/cn/user-manual/shardingsphere-proxy/distsql/
-[2] SHOW SHARDING TABLE RULE:
documentationhttps://shardingsphere.apache.org/document/5.3.1/cn/user-manual/shardingsphere-proxy/distsql/syntax/rql/rule-query/sharding/show-sharding-table-rule/
-[3] SHOW READWRITE_SPLITTING RULE:
https://shardingsphere.apache.org/document/5.3.1/cn/user-manual/shardingsphere-proxy/distsql/syntax/rql/rule-query/readwrite-splitting/show-readwrite-splitting-rule/
-[4] Using the ShardingSphere-Proxy binary release package:
https://shardingsphere.apache.org/document/5.3.1/cn/user-manual/shardingsphere-proxy/startup/bin/
-[5] GitHub issue list: https://github.com/apache/shardingsphere/issues
-```
-
+[1] [DistSQL
Documentation](https://shardingsphere.apache.org/document/5.3.1/cn/user-manual/shardingsphere-proxy/distsql/)
+[2] [SHOW SHARDING TABLE RULE:
documentation](https://shardingsphere.apache.org/document/5.3.1/cn/user-manual/shardingsphere-proxy/distsql/syntax/rql/rule-query/sharding/show-sharding-table-rule/)
+[3] [SHOW READWRITE_SPLITTING
RULE](https://shardingsphere.apache.org/document/5.3.1/cn/user-manual/shardingsphere-proxy/distsql/syntax/rql/rule-query/readwrite-splitting/show-readwrite-splitting-rule/)
+[4] [Using the ShardingSphere-Proxy binary release
package](https://shardingsphere.apache.org/document/5.3.1/cn/user-manual/shardingsphere-proxy/startup/bin/)
+[5] [GitHub issue list](https://github.com/apache/shardingsphere/issues)
\ No newline at end of file
diff --git
a/docs/blog/content/material/2023_04_03_ShardingSphere_5.3.2_Release_Apollo_Integration,_Better_Data_Migration,_and_Stronger_Encryption.en.md
b/docs/blog/content/material/2023_04_03_ShardingSphere_5.3.2_Release_Apollo_Integration,_Better_Data_Migration,_and_Stronger_Encryption.en.md
new file mode 100644
index 00000000000..70f526a2770
--- /dev/null
+++
b/docs/blog/content/material/2023_04_03_ShardingSphere_5.3.2_Release_Apollo_Integration,_Better_Data_Migration,_and_Stronger_Encryption.en.md
@@ -0,0 +1,134 @@
++++
+title = "ShardingSphere 5.3.2 Release: Apollo Integration, Better Data
Migration, and Stronger Encryption"
+weight = 94
+chapter = true
++++
+
+
+
+Apache ShardingSphere has recently released version 5.3.2 after two months of
development, which includes 797 PRs from teams and individuals worldwide. The
new version includes significant improvements in functionality, performance,
testing, documentation, and examples. With this update, users can experience an
enhanced and problem-solving version. Let's take a quick preview of what's new:
+
+- ShardingSphere Driver now supports Apollo, which is a great addition for
users.
+- Data migration now supports migrating tables with any index structure,
including tables without an index, making it more convenient for users.
+- The data encryption fuzzy query now supports the CONCAT function, improving
the user's experience.
+
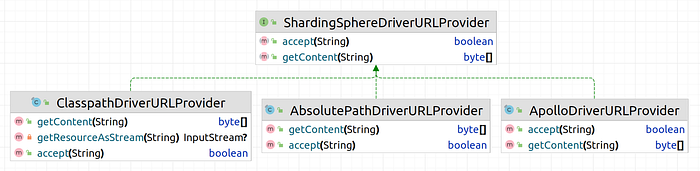
+One of the highlights of this update is that the ShardingSphere Driver now
supports Apollo. In version 5.3.0, ShardingSphere removed modules such as
Spring Boot Starter and standardized the use of the standard JDBC Driver to
specify configuration files. However, the ShardingSphere Driver could only read
configuration from the file system, which was limited to scenarios where the
configuration was managed uniformly in the configuration center. With the
recent update, ShardingSphere 5.3.2 [...]
+
+
+
+The JDBC URL is written as follows:
+
+```bash
+# Read the configuration file from the absolute path
+jdbc:shardingsphere:absolutepath:/path/to/config.yml
+
+# Read the configuration file from the classpath
+jdbc:shardingsphere:classpath:config/shardingsphere/config.yml
+
+# Read the configuration file from the Apollo configuration center
+jdbc:shardingsphere:apollo:apollo.meta?appid=ss-test&namespace=config
+```
+
+Of course, providing an SPI interface means that developers can customize the
configuration reading logic according to their own scenarios, such as
implementing configuration reading from other registration centers. At the same
time, the ShardingSphere community welcomes developers to contribute to the
common configuration implementation, allowing more users to benefit from it.
+
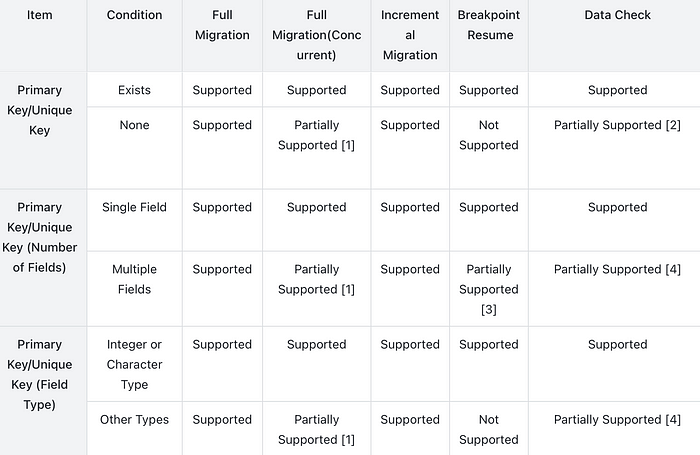
+## Migrate Tables with Any Index Structure, Including Tables Without an Index
+
+ShardingSphere is now providing support for migrating tables with any index
structure, including tables without an index. This is a significant improvement
that will greatly benefit users with complex application scenarios.
+
+In some cases, tables may have composite primary keys, while in others, they
may not have primary keys but have composite unique indexes. In some cases,
tables may not have any primary keys or indexes at all. ShardingSphere has
taken these complex scenarios into account and has made certain improvements to
support data migration for such cases.
+
+This is a significant step forward in providing users with more flexibility in
managing their data and ensuring that their applications are running smoothly.
The improved data migration support will make it easier for users to manage
their data, regardless of the complexity of their table structures.
+
+
+
+[1] Concurrency is supported between shards, but data partitioning within a
table does not support concurrency.
+
+[2] `DATA_MATCH` consistency check is not supported. `CRC32_MATCH` is only
supported by MySQL.
+
+[3] Breakpoint resume is supported only for the first field.
+
+[4] Primary key tables of some field types can not be aggregated and sorted,
so the `DATA_MATCH` consistency check is not supported, such as `VARBINARY` in
MySQL.
+
+## The Data Encryption Fuzzy Query Now Supports the CONCAT Function
+
+Since ShardingSphere 5.3.0 supported encrypted column fuzzy queries, the
community received feedback from users regarding this function. The fuzzy query
`LIKE` is often used in conjunction with the wildcard `%` through the `CONCAT`
function in SQL. Some users reported that ShardingSphere does not support
queries with wildcards concatenated through the `CONCAT` function in SQL and
can only complete wildcard concatenation on parameter values themselves.
+
+With the release of version 5.3.2, ShardingSphere has made further
improvements in supporting functions in encryption. Now, the wildcard for fuzzy
queries can be used directly in SQL in the following format:
+
+```
+select * from t where user_name like CONCAT('%', ?, '%')
+```
+
+Regarding the support for other functions, if you are interested in Apache
ShardingSphere, you are welcome to participate in the community to help us
achieve further improvement in the support for other functions.
+
+## Release Notes
+
+**API Changes**
+
+- Proxy: Added the property `system-log-level` to support dynamic changes to
the log level.
+- DistSQL: Removed the Hint-related DistSQL; users can now use SQL `Hint`
instead.
+
+**New Features**
+
+- Scaling: Pipeline job now supports tables with any index structure.
+
+**Enhancements**
+
+- Scaling: Uses JDBC stream query for inventory dump and data consistency
check.
+- Scaling: Pipeline jobs are now compatible with tables that have MySQL
binary-type fields as primary keys.
+- Scaling: The migration and other jobs are now implemented in a blocking
manner, making it easier for ejob to obtain the real lifecycle of the jobs and
support failover.
+- Scaling: Improved large table records count estimation.
+- Scaling: Support proxy sharding rule absent for migration jobs, including
migration to a single table or pure encryption.
+- Scaling: Added `useServerPrepStmts=false` to avoid exceeding the limit of
precompiled statements on the MySQL server.
+- Scaling: MySQL binlog now returns accurate data types when parsing
datetime/time instead of strings.
+- Scaling: Added global status for the pipeline preparation stage.
+- Scaling: Added `netTimeoutForStreamingResults` to prevent MySQL streaming
data consumption from being too slow and causing the connection to be closed by
the server.
+- Authority: Supports specifying password authentication method.
+- Authority: Added md5 authentication support for openGauss protocol.
+- Agent: Added more monitoring metrics for JDBC.
+- Kernel: ShardingSphere Driver configuration is now based on SPI and supports
Apollo.
+- Kernel: Adjusted `SKIP_ENCRYPT_REWRITE `SQL Hint to `SKIP_SQL_REWRITE`to
support more scenarios.
+- Kernel: Support openGauss `EXPLAIN PERFORMANCE` syntax.
+- Encrypt: `LIKE` now supports `CONCAT` function.
+
+**Bug Fixes**
+
+- Scaling: Fixed the issue where `TestDecodingPlugin` parsed Unicode
characters incorrectly.
+- Scaling: PostgreSQL migration now supports fields related to JSON.
+- DistSQL: `CREATE SHARDING TABLE RULE` now supports `NONE` strategy.
+- Kernel: Fixed the issue of an error when using the system database with an
empty data source.
+- Kernel: Fixed the issue where setting worker-id does not take effect with
Standalone mode.
+- Kernel: Cleared storage node information when deleting read/write-splitting
and database discovery rules.
+- Kernel: Fixed the abnormal problem of Column index out of range in single
table complex query.
+- Kernel: Fixed the issue where PostgreSQL `LIKE` queries (using lowercase)
failed.
+- Kernel: Fixed the exception of built-in metabase data collection when the
front and back database types were inconsistent.
+- Kernel: Fixed the problem of routing error reporting under certain table
names.
+- Kernel: Fixed the issue where parsing errors occurred when creating MySQL
stored procedures.
+- Kernel: Fixed NPE caused by incorrect extraction of table names in union
statements.
+- Kernel: Fixed the issue where uppercase table name constraints were not
rewritten.
+- Kernel: Fixed the issue where PostgreSQL/OpenGauss SQL containing money type
caused parsing errors.
+- Kernel: Fixed the issue where using placeholders and type conversions
simultaneously in PostgreSQL/OpenGauss caused SQL parsing errors.
+- Kernel: Fixed the issue where syntax errors occurred when parsing constant
type conversions in PostgreSQL/OpenGauss.
+- Kernel: Fixed Chinese character encoding exception when executing select
with SQL Federation engine.
+- Kernel: Fixed IndexOutOfBoundsException when executing set variable
statement in JDBC adapter.
+- Kernel: Fixed index does not exist exception when executing drop index
statement.
+- Proxy: Properly handled number signs in MySQL Proxy binary protocol.
+- Proxy: Fixed the issue where PostgreSQL/openGauss Proxy failed to handle
bytea data type.
+- Proxy: Fixed the issue where PostgreSQL Proxy failed to parse time value
with microseconds.
+- Proxy: Fixed the exception when the client passes quoted charset to
PostgreSQL/openGauss Proxy.
+
+Overall, this new version of Apache ShardingSphere brings significant
improvements and features that can help users solve their problems more
efficiently. The community has done an excellent job of addressing user
feedback and improving the overall user experience.
+
+This Apache ShardingSphere 5.3.2 release is the result of 797 merged PRs, made
by 37 contributors. Thank you for your passion!
+
+
+
+# Relevant Links
+
+🔗 [Download
Link](https://shardingsphere.apache.org/document/current/en/downloads/)
+
+🔗 [Release
Notes](https://github.com/apache/shardingsphere/blob/master/RELEASE-NOTES.md)
+
+🔗 [Project Address](https://shardingsphere.apache.org/)
+
+🔗 [ShardingSphere-on-Cloud](https://github.com/apache/shardingsphere-on-cloud)
diff --git
a/docs/blog/content/material/2023_04_11_Monitoring_SQL_Performance_with_ShardingSphere-Agent,_Prometheus_and_Grafana.en.md
b/docs/blog/content/material/2023_04_11_Monitoring_SQL_Performance_with_ShardingSphere-Agent,_Prometheus_and_Grafana.en.md
new file mode 100644
index 00000000000..325dd13773a
--- /dev/null
+++
b/docs/blog/content/material/2023_04_11_Monitoring_SQL_Performance_with_ShardingSphere-Agent,_Prometheus_and_Grafana.en.md
@@ -0,0 +1,223 @@
++++
+title = "Monitoring SQL Performance with ShardingSphere-Agent, Prometheus and
Grafana"
+weight = 95
+chapter = true
++++
+
+
+
+As business systems become more complex, users are increasingly concerned
about system performance and the need to monitor relevant metrics during system
operation. This includes obtaining real-time monitoring metric information,
monitoring and warning of relevant issues, and combining business analysis to
locate anomalies.
+
+Application Performance Monitoring (APM) monitors and diagnoses system
performance by collecting, storing, and analyzing system data that can be
observed. Its main functions include performance metric monitoring, call chain
analysis, and application topology maps. Generally, system operation status
performance data is obtained through Metrics, Tracing, and Logging.
+
+This article will explain how ShardingSphere-Agent collects
ShardingSphere-JDBC monitoring metrics and how to display them visually.
+
+# Implementation
+
+There are two methods that are generally considered when collecting metrics:
manually tracking events in business methods and using Java Agent for
non-intrusive event tracking. Method one has too much business intrusion and is
not a good choice for including non-business logic in the business. Therefore,
it is generally a better choice to use Java Agent for non-intrusive event
tracking.
+
+Depending on the Java Agent, modifying the bytecode of the target for data
collection is also called probe technology. ShardingSphere-Agent uses Java
Agent to add an agent proxy when JVM starts and use Byte Buddy to modify the
target bytecode to implant data collection logic.
+
+# Module Introduction
+
+`shardingsphere-agent-api`: Defines enhanced interfaces, plugin
configurations, and more.
+
+`shardingsphere-agent-core`: Defines plugin loading processes and agent entry.
+
+`shardingsphere-agent-plugins`: Defines plugins.
+
+This article mainly introduces the indicator plugin under the
`shardingsphere-agent-plugins` module. Under this module, the indicator plugin
mainly has the following modules.
+
+- `shardingsphere-agent-metrics-core`: Indicator collection definition module
+- `shardingsphere-agent-metrics-prometheus`: Indicator data exposure module
+
+# Event Tracking Setting
+
+Meaningful classes should be considered for tracking. For example, in
ShardingSphere-JDBC, the most commonly used and important are the
`ShardingSphereStatement` and `ShardingSpherePreparedStatement`. We often use
the execute, `executeQuery`, and `executeUpdate` methods of these two classes
to run SQL, so these methods are also the most important places we should pay
attention to. The relevant metrics can be collected through these methods too.
+
+For example, the execution time counts of these methods can be tracked. The
existing indicator `jdbc_statement_execute_latency_millis logs the execute`,
`executeQuery`, and `executeUpdate` methods of `ShardingSphereStatement` and
`ShardingSpherePreparedStatement` and tracks the execution time of methods.
+
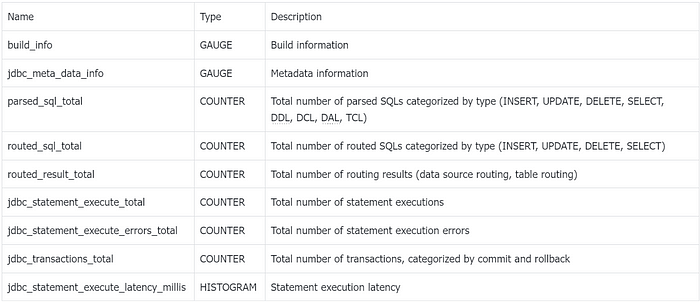
+# Metrics
+
+## ShardingSphere-JDBC Monitoring Metrics
+
+The monitoring metrics collected by ShardingSphere-Agent comply with the
**OpenMetrics** standard. The following table describes the metrics:
+
+
+
+These metrics can be used to monitor the performance of ShardingSphere-JDBC
and identify any issues that may arise. The metrics are collected and displayed
visually using the indicator plugin under the shardingsphere-agent-plugins
module.
+
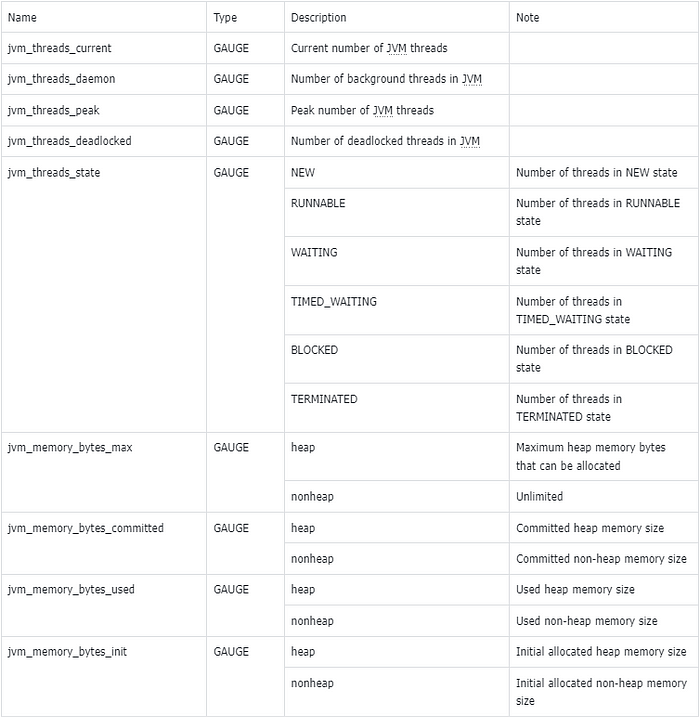
+## JVM Monitoring Metrics
+
+In addition to collecting metrics for ShardingSphere-JDBC,
ShardingSphere-Agent also exposes relevant metrics for the JVM. The following
table describes these metrics:
+
+
+
+These metrics can be used to monitor the performance of the JVM and identify
any issues that may arise. The metrics are collected and displayed visually
using the indicator plugin under the shardingsphere-agent-plugins module.
+
+Metric Type Explanation:
+
+- GAUGE-type metrics indicate that the metric value can increase or decrease.
+- COUNTER-type metrics indicate that the metric value can only increase and
never decrease.
+- HISTOGRAM-type metrics represent a histogram that is mainly used for the
distribution of metric values, such as the method execution time.
+
+# User Guide
+
+Example using a Spring Boot project integrated with ShardingSphere-JDBC: To
demonstrate how to collect and display metrics using ShardingSphere-Agent, we
will use a Spring Boot project that integrates with ShardingSphere-JDBC. Follow
the steps below to set up the project:
+
+1. Download the spring-boot-shardingsphere-jdbc-test.jar file. You can find
instructions on how to configure it from the official ShardingSphere
[documentation](https://shardingsphere.apache.org/document/current/en/downloads/)
[1].
+2. Download ShardingSphere-Agent from the [official
website](https://shardingsphere.apache.org/document/current/en/user-manual/shardingsphere-jdbc/)
[2]. Note that ShardingSphere-JDBC and ShardingSphere-Agent must be of the
same version and supported from version 5.3.2.
+3. Set up the ShardingSphere-Agent directory structure as follows:
+
+```Bash
+cd agent
+tree
+├── LICENSE
+├── NOTICE
+├── conf
+│ └── agent.yaml
+├── plugins
+│ ├── lib
+│ │ ├── shardingsphere-agent-metrics-core-${latest.release.version}.jar
+│ │ └── shardingsphere-agent-plugin-core-${latest.release.version}.jar
+│ ├── logging
+│ │ └── shardingsphere-agent-logging-file-${latest.release.version}.jar
+│ ├── metrics
+│ │ └──
shardingsphere-agent-metrics-prometheus-${latest.release.version}.jar
+│ └── tracing
+│ ├──
shardingsphere-agent-tracing-opentelemetry-${latest.release.version}.jar
+└── shardingsphere-agent-${latest.release.version}.jar
+```
+
+- Configure the `agent.yaml` file to enable monitoring.
+
+```YAML
+plugins:
+ metrics:
+ Prometheus:
+ host: "localhost"
+ port: 39090
+ props:
+ jvm-information-collector-enabled: "true"
+```
+
+Configuration details:
+
+- `host` represents the IP address at which the metrics are exposed on the
local machine. The default is `localhost`.
+- `port` represents the port on which the metrics are exposed.
+- `jvm-information-collector-enabled` represents whether JVM-related metric
information is collected. The default is `true`.
+
+Start the project
+
+```Shell
+java
-javaagent:${agentPath}/agent/shardingsphere-agent-${latest.release.version}.jar
-jar spring-boot-shardingsphere-jdbc-test.jar
+```
+
+Note: The `javaagent` should be configured with the absolute path of the jar
file.
+
+After the project is started, make requests to the relevant business
interfaces in the project to trigger the related tracking and generate metric
data.
+
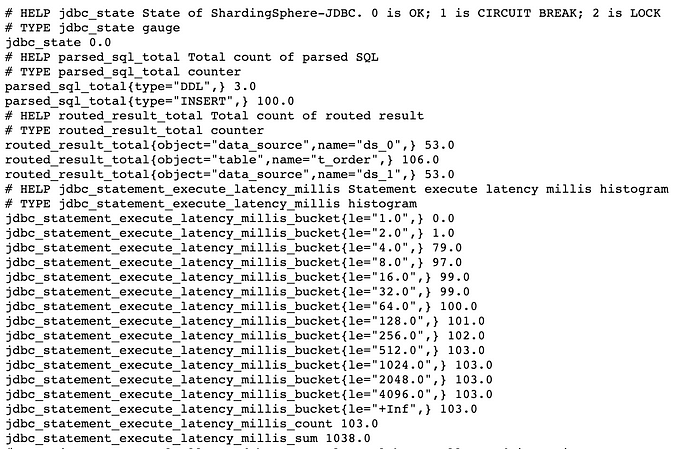
+Next, visit [http://127.0.0.1:39090,](http://127.0.0.1:39090,/) where the
exposed metrics data is located, to obtain data information. The following is
the screenshot of some metrics:
+
+
+
+Note:
+
+The `jdbc_statement_execute_latency_millis_bucket`,
`jdbc_statement_execute_latency_millis_count`, and
`jdbc_statement_execute_latency_millis_sum` in the above screenshot are derived
from the `jdbc_statement_execute_latency_millis` metric.
+
+According to the metric specification, when a HISTOGRAM-type metric is
generated, metrics with the suffix `_bucket`, `_count`, and `_sum` are
automatically generated. We will discuss how to use them later.
+
+In production scenarios, Prometheus is often used for metric collection and
storage, and Grafana is used for visualization. Next, we will configure
Prometheus and Grafana.
+
+**Prometheus**
+
+Add the following configuration to the `prometheus.yml` file to collect
monitoring data. For detailed usage of Prometheus, please refer to the
[Prometheus official website](https://prometheus.io/) [3].
+
+```YAML
+scrape_configs:
+ - job_name: "jdbc"
+ static_configs:
+ - targets: ["127.0.0.1:39090"]
+```
+
+**Grafana**
+
+To visualize the collected monitoring data in Grafana, we need to set up a
Prometheus data source and write PromQL queries to extract the desired metric
data. For more information on using Grafana, please refer to the [official
website](https://grafana.com/) [4]. To learn how to use PromQL, please refer to
the [official documentation](https://prometheus.io/) [5].
+
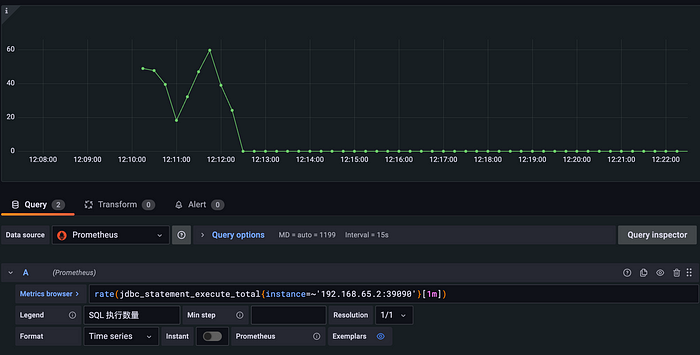
+As an example, we can use the `jdbc_statement_execute_total` metric to display
the average number of SQL statements executed per minute. Here is an example of
how to achieve this:
+
+```SQL
+rate(jdbc_statement_execute_total{instance=~'192.168.65.2:39090'}[1m])
+```
+
+
+
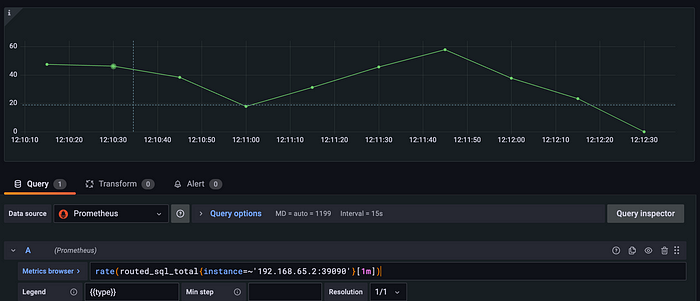
+To view SQL metrics routed to the backend database, the `routed_sql_total`
metric can be used for display. This metric uses the `type` tag to separate SQL
statements by their types (INSERT, UPDATE, DELETE, and SELECT), making it
easier to analyze the statistics of different types of SQL.
+
+```SQL
+rate(routed_sql_total{instance=~'192.168.65.2:39090'}[1m])
+```
+
+
+
+Other COUNTER-type metrics can be obtained using a similar PromSQL statement.
We encourage you to try them out yourself.
+
+Often, we are more concerned about the time it takes to execute SQL
statements. In this case, the `jdbc_statement_execute_latency_millis` metric is
exactly what we need. The format and meaning of the exposed original metric are
explained below:
+
+```HTML
+# HELP jdbc_statement_execute_latency_millis Statement execute latency millis
histogram
+# TYPE jdbc_statement_execute_latency_millis histogram
+jdbc_statement_execute_latency_millis_bucket{le="1.0",} 0.0
+jdbc_statement_execute_latency_millis_bucket{le="2.0",} 898.0
+jdbc_statement_execute_latency_millis_bucket{le="4.0",} 5065.0
+jdbc_statement_execute_latency_millis_bucket{le="8.0",} 5291.0
+jdbc_statement_execute_latency_millis_bucket{le="16.0",} 5319.0
+jdbc_statement_execute_latency_millis_bucket{le="32.0",} 5365.0
+jdbc_statement_execute_latency_millis_bucket{le="64.0",} 5404.0
+jdbc_statement_execute_latency_millis_bucket{le="128.0",} 5405.0
+jdbc_statement_execute_latency_millis_bucket{le="256.0",} 5458.0
+jdbc_statement_execute_latency_millis_bucket{le="512.0",} 5459.0
+jdbc_statement_execute_latency_millis_bucket{le="1024.0",} 5459.0
+jdbc_statement_execute_latency_millis_bucket{le="2048.0",} 5459.0
+jdbc_statement_execute_latency_millis_bucket{le="4096.0",} 5459.0
+jdbc_statement_execute_latency_millis_bucket{le="+Inf",} 5459.0
+jdbc_statement_execute_latency_millis_count 5459.0
+jdbc_statement_execute_latency_millis_sum 27828.0
+```
+
+- The `jdbc_statement_execute_latency_millis_bucket{le="1.0",} 0.0` indicates
the number of times the execution time is within 1 millisecond, which is 0 in
this case.
+- The `jdbc_statement_execute_latency_millis_bucket{le="2.0",} 898.0`
indicates the number of times the execution time is within 2 milliseconds,
which is 898 in this case.
+- The `jdbc_statement_execute_latency_millis_bucket{le="4.0",} 5065.0`
indicates the number of times the execution time is within 4 milliseconds,
which is 5065 in this case.
+- In line 16, “+Inf” represents statistics beyond the maximum execution time,
which in this case represents statistics beyond 4096 milliseconds.
+- The `jdbc_statement_execute_latency_millis_count 5459.0` represents the
total number of executions, which is 5459 in this case.
+- The `jdbc_statement_execute_latency_millis_sum 27828.0` represents the total
execution time, which is 27828 milliseconds in this case.
+
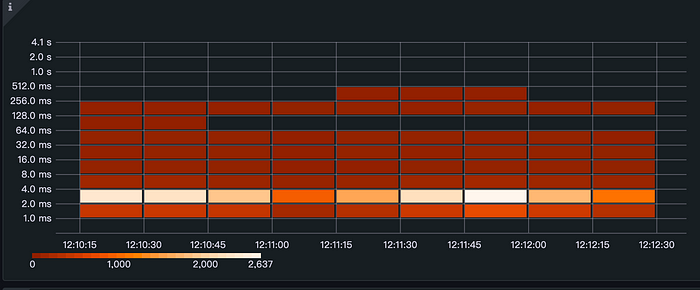
+```SQL
+ceil(sum(increase(jdbc_statement_execute_latency_millis_bucket{instance=~'192.168.65.2:39090',
le!='+Inf'}[1m])) by (le))
+```
+
+
+
+The heat map effectively visualizes the distribution of execution time,
providing valuable insights into the performance of the system.
+
+Many metrics can be collected and analyzed using Prometheus and Grafana. By
monitoring these metrics and identifying patterns and trends in the data, users
can gain valuable insights into the performance and health of their systems,
and take proactive measures to optimize performance and prevent issues before
they occur.
+
+# Conclusion
+
+We welcome you to actively participate in enriching and improving the
monitoring indicators of ShardingSphere-JDBC. If you have any questions or
suggestions, please feel free to raise them in the [GitHub
issue](https://github.com/apache/shardingsphere/issues) [6], or join our [Slack
community](https://apacheshardingsphere.slack.com/ssb/redirect) [7] for
discussions.
+
+# Related Links
+
+[1] [ShardingSphere-JDBC official website
documentation](https://shardingsphere.apache.org/document/current/en/user-manual/shardingsphere-jdbc/)
+
+[2] [ShardingSphere-Agent download
address](https://shardingsphere.apache.org/document/current/en/downloads/)
+
+[3] [Prometheus official website](https://prometheus.io/)
+
+[4] [Grafana official website](https://grafana.com/)
+
+[5] [PromSQL official
documentation](https://prometheus.io/docs/prometheus/latest/querying/basics/)
+
+[6] [GitHub issues](https://github.com/apache/shardingsphere/issues)
+
+[7] [Slack community](https://apacheshardingsphere.slack.com/ssb/redirect)
diff --git
a/docs/blog/static/img/2023_04_03_ShardingSphere_5.3.2_Release_Apollo_Integration,_Better_Data_Migration,_and_Stronger_Encryption1.png
b/docs/blog/static/img/2023_04_03_ShardingSphere_5.3.2_Release_Apollo_Integration,_Better_Data_Migration,_and_Stronger_Encryption1.png
new file mode 100644
index 00000000000..81ff9763d0a
Binary files /dev/null and
b/docs/blog/static/img/2023_04_03_ShardingSphere_5.3.2_Release_Apollo_Integration,_Better_Data_Migration,_and_Stronger_Encryption1.png
differ
diff --git
a/docs/blog/static/img/2023_04_03_ShardingSphere_5.3.2_Release_Apollo_Integration,_Better_Data_Migration,_and_Stronger_Encryption2.png
b/docs/blog/static/img/2023_04_03_ShardingSphere_5.3.2_Release_Apollo_Integration,_Better_Data_Migration,_and_Stronger_Encryption2.png
new file mode 100644
index 00000000000..7779011fe98
Binary files /dev/null and
b/docs/blog/static/img/2023_04_03_ShardingSphere_5.3.2_Release_Apollo_Integration,_Better_Data_Migration,_and_Stronger_Encryption2.png
differ
diff --git
a/docs/blog/static/img/2023_04_03_ShardingSphere_5.3.2_Release_Apollo_Integration,_Better_Data_Migration,_and_Stronger_Encryption3.png
b/docs/blog/static/img/2023_04_03_ShardingSphere_5.3.2_Release_Apollo_Integration,_Better_Data_Migration,_and_Stronger_Encryption3.png
new file mode 100644
index 00000000000..136ded737d0
Binary files /dev/null and
b/docs/blog/static/img/2023_04_03_ShardingSphere_5.3.2_Release_Apollo_Integration,_Better_Data_Migration,_and_Stronger_Encryption3.png
differ
diff --git
a/docs/blog/static/img/2023_04_03_ShardingSphere_5.3.2_Release_Apollo_Integration,_Better_Data_Migration,_and_Stronger_Encryption4.png
b/docs/blog/static/img/2023_04_03_ShardingSphere_5.3.2_Release_Apollo_Integration,_Better_Data_Migration,_and_Stronger_Encryption4.png
new file mode 100644
index 00000000000..5b2530cedcd
Binary files /dev/null and
b/docs/blog/static/img/2023_04_03_ShardingSphere_5.3.2_Release_Apollo_Integration,_Better_Data_Migration,_and_Stronger_Encryption4.png
differ
diff --git
a/docs/blog/static/img/2023_04_11_Monitoring_SQL_Performance_with_ShardingSphere-Agent,_Prometheus_and_Grafana1.png
b/docs/blog/static/img/2023_04_11_Monitoring_SQL_Performance_with_ShardingSphere-Agent,_Prometheus_and_Grafana1.png
new file mode 100644
index 00000000000..95709e6649c
Binary files /dev/null and
b/docs/blog/static/img/2023_04_11_Monitoring_SQL_Performance_with_ShardingSphere-Agent,_Prometheus_and_Grafana1.png
differ
diff --git
a/docs/blog/static/img/2023_04_11_Monitoring_SQL_Performance_with_ShardingSphere-Agent,_Prometheus_and_Grafana2.png
b/docs/blog/static/img/2023_04_11_Monitoring_SQL_Performance_with_ShardingSphere-Agent,_Prometheus_and_Grafana2.png
new file mode 100644
index 00000000000..f7416f0f129
Binary files /dev/null and
b/docs/blog/static/img/2023_04_11_Monitoring_SQL_Performance_with_ShardingSphere-Agent,_Prometheus_and_Grafana2.png
differ
diff --git
a/docs/blog/static/img/2023_04_11_Monitoring_SQL_Performance_with_ShardingSphere-Agent,_Prometheus_and_Grafana3.png
b/docs/blog/static/img/2023_04_11_Monitoring_SQL_Performance_with_ShardingSphere-Agent,_Prometheus_and_Grafana3.png
new file mode 100644
index 00000000000..2e0eb501834
Binary files /dev/null and
b/docs/blog/static/img/2023_04_11_Monitoring_SQL_Performance_with_ShardingSphere-Agent,_Prometheus_and_Grafana3.png
differ
diff --git
a/docs/blog/static/img/2023_04_11_Monitoring_SQL_Performance_with_ShardingSphere-Agent,_Prometheus_and_Grafana4.png
b/docs/blog/static/img/2023_04_11_Monitoring_SQL_Performance_with_ShardingSphere-Agent,_Prometheus_and_Grafana4.png
new file mode 100644
index 00000000000..b525d0b4228
Binary files /dev/null and
b/docs/blog/static/img/2023_04_11_Monitoring_SQL_Performance_with_ShardingSphere-Agent,_Prometheus_and_Grafana4.png
differ
diff --git
a/docs/blog/static/img/2023_04_11_Monitoring_SQL_Performance_with_ShardingSphere-Agent,_Prometheus_and_Grafana5.png
b/docs/blog/static/img/2023_04_11_Monitoring_SQL_Performance_with_ShardingSphere-Agent,_Prometheus_and_Grafana5.png
new file mode 100644
index 00000000000..96cb7330f62
Binary files /dev/null and
b/docs/blog/static/img/2023_04_11_Monitoring_SQL_Performance_with_ShardingSphere-Agent,_Prometheus_and_Grafana5.png
differ
diff --git
a/docs/blog/static/img/2023_04_11_Monitoring_SQL_Performance_with_ShardingSphere-Agent,_Prometheus_and_Grafana6.png
b/docs/blog/static/img/2023_04_11_Monitoring_SQL_Performance_with_ShardingSphere-Agent,_Prometheus_and_Grafana6.png
new file mode 100644
index 00000000000..85db300fb15
Binary files /dev/null and
b/docs/blog/static/img/2023_04_11_Monitoring_SQL_Performance_with_ShardingSphere-Agent,_Prometheus_and_Grafana6.png
differ
diff --git
a/docs/blog/static/img/2023_04_11_Monitoring_SQL_Performance_with_ShardingSphere-Agent,_Prometheus_and_Grafana7.png
b/docs/blog/static/img/2023_04_11_Monitoring_SQL_Performance_with_ShardingSphere-Agent,_Prometheus_and_Grafana7.png
new file mode 100644
index 00000000000..33fd5055f2e
Binary files /dev/null and
b/docs/blog/static/img/2023_04_11_Monitoring_SQL_Performance_with_ShardingSphere-Agent,_Prometheus_and_Grafana7.png
differ