This is an automated email from the ASF dual-hosted git repository.

wusheng pushed a commit to branch master
in repository https://gitbox.apache.org/repos/asf/skywalking.git
The following commit(s) were added to refs/heads/master by this push:
new 1b38dd9526 Add Spring Sleuth dashboard to general service instance
template (#9478)
1b38dd9526 is described below
commit 1b38dd9526b2d92da84a5cfdf67a1a7b817946eb
Author: mrproliu <[email protected]>
AuthorDate: Thu Aug 18 08:15:42 2022 +0800
Add Spring Sleuth dashboard to general service instance template (#9478)
---
docs/en/changes/changes.md | 2 +
docs/en/setup/backend/spring-sleuth-setup.md | 15 +-
docs/en/ui/README.md | 47 ++-
.../general/general-instance.json | 370 +++++++++++++++++++++
4 files changed, 422 insertions(+), 12 deletions(-)
diff --git a/docs/en/changes/changes.md b/docs/en/changes/changes.md
index 06d953b930..323126e1f8 100644
--- a/docs/en/changes/changes.md
+++ b/docs/en/changes/changes.md
@@ -87,6 +87,7 @@
* Fix query order for trace list.
* Add a calculation to convert seconds to days.
* Add component ID(131) for Java Micronaut plugin
+* Add Spring Sleuth dashboard to general service instance.
#### Documentation
@@ -94,5 +95,6 @@
* Clean up doc about event metrics.
* Add a table for metric calculations in the ui doc.
* Add an explanation for alerting kernel and its in-memory window mechanism.
+* Add more docs for widget details.
All issues and pull requests are
[here](https://github.com/apache/skywalking/milestone/136?closed=1)
diff --git a/docs/en/setup/backend/spring-sleuth-setup.md
b/docs/en/setup/backend/spring-sleuth-setup.md
index de387a0f7d..10f2d9e57d 100644
--- a/docs/en/setup/backend/spring-sleuth-setup.md
+++ b/docs/en/setup/backend/spring-sleuth-setup.md
@@ -46,20 +46,13 @@ agent-analyzer:
meterAnalyzerActiveFiles: ${SW_METER_ANALYZER_ACTIVE_FILES:spring-sleuth}
```
-## Add UI dashboard
+## Dashboard configuration
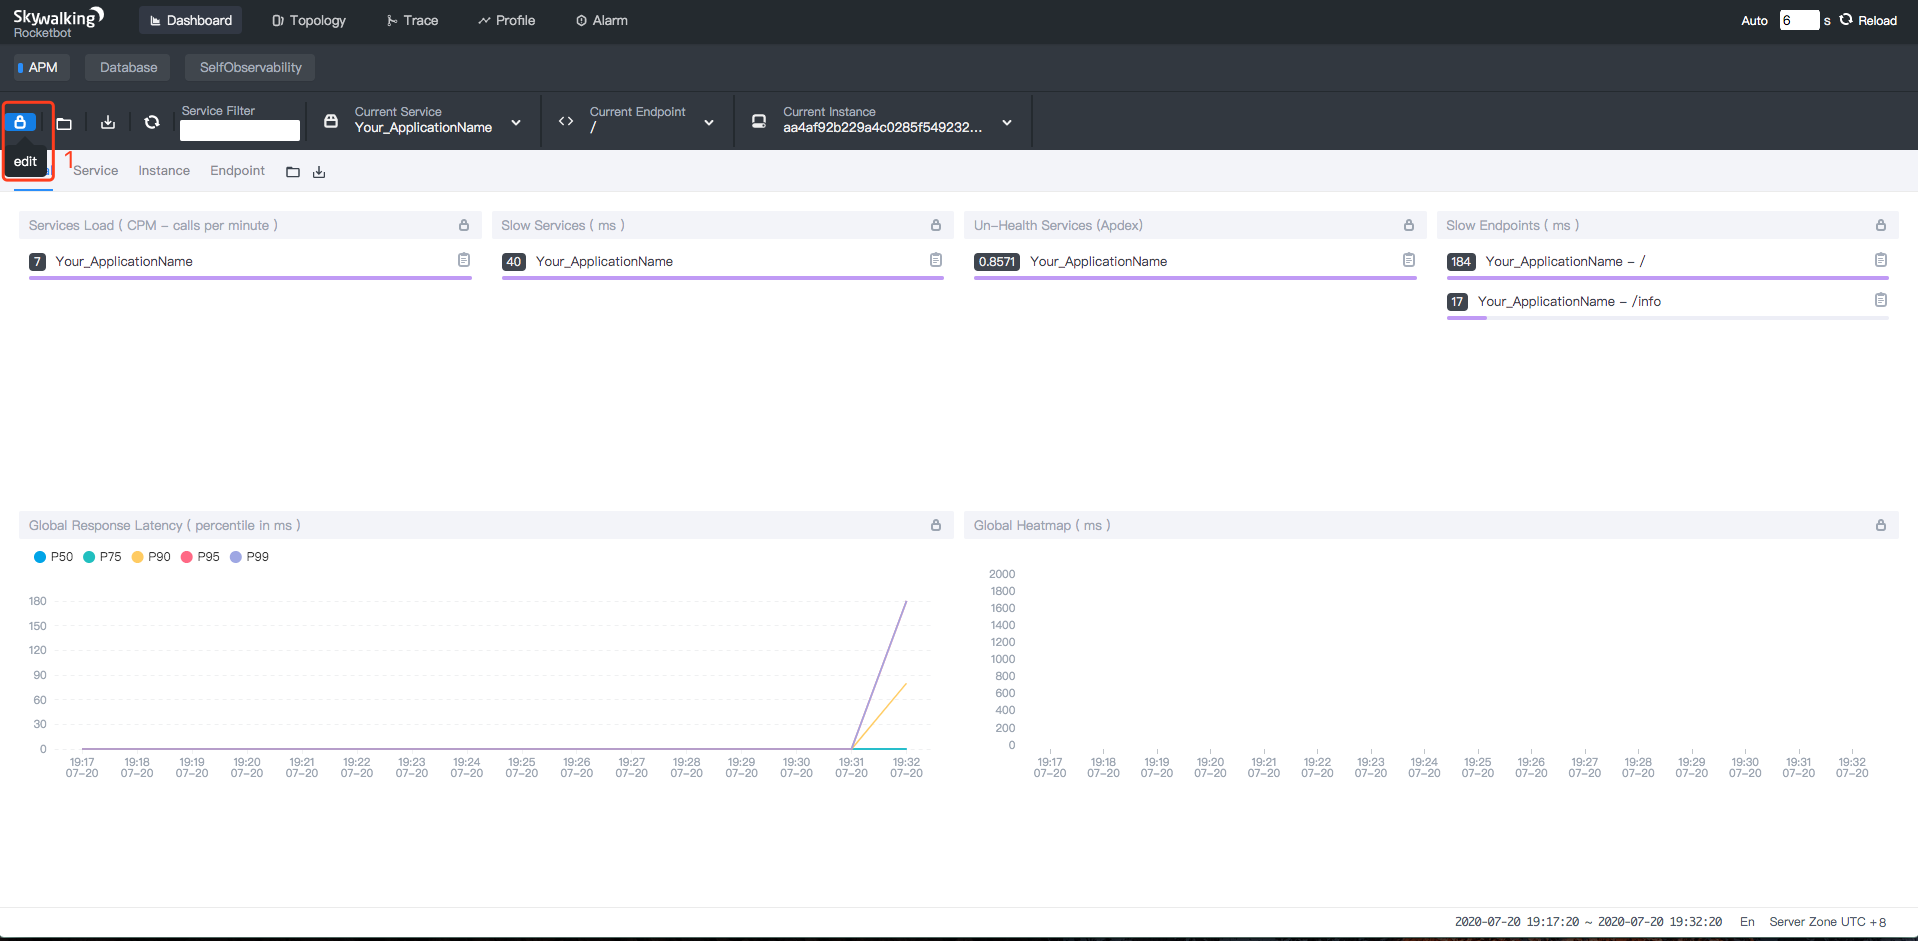
-1. Open the dashboard view. Click `edit` button to edit the templates.
- 
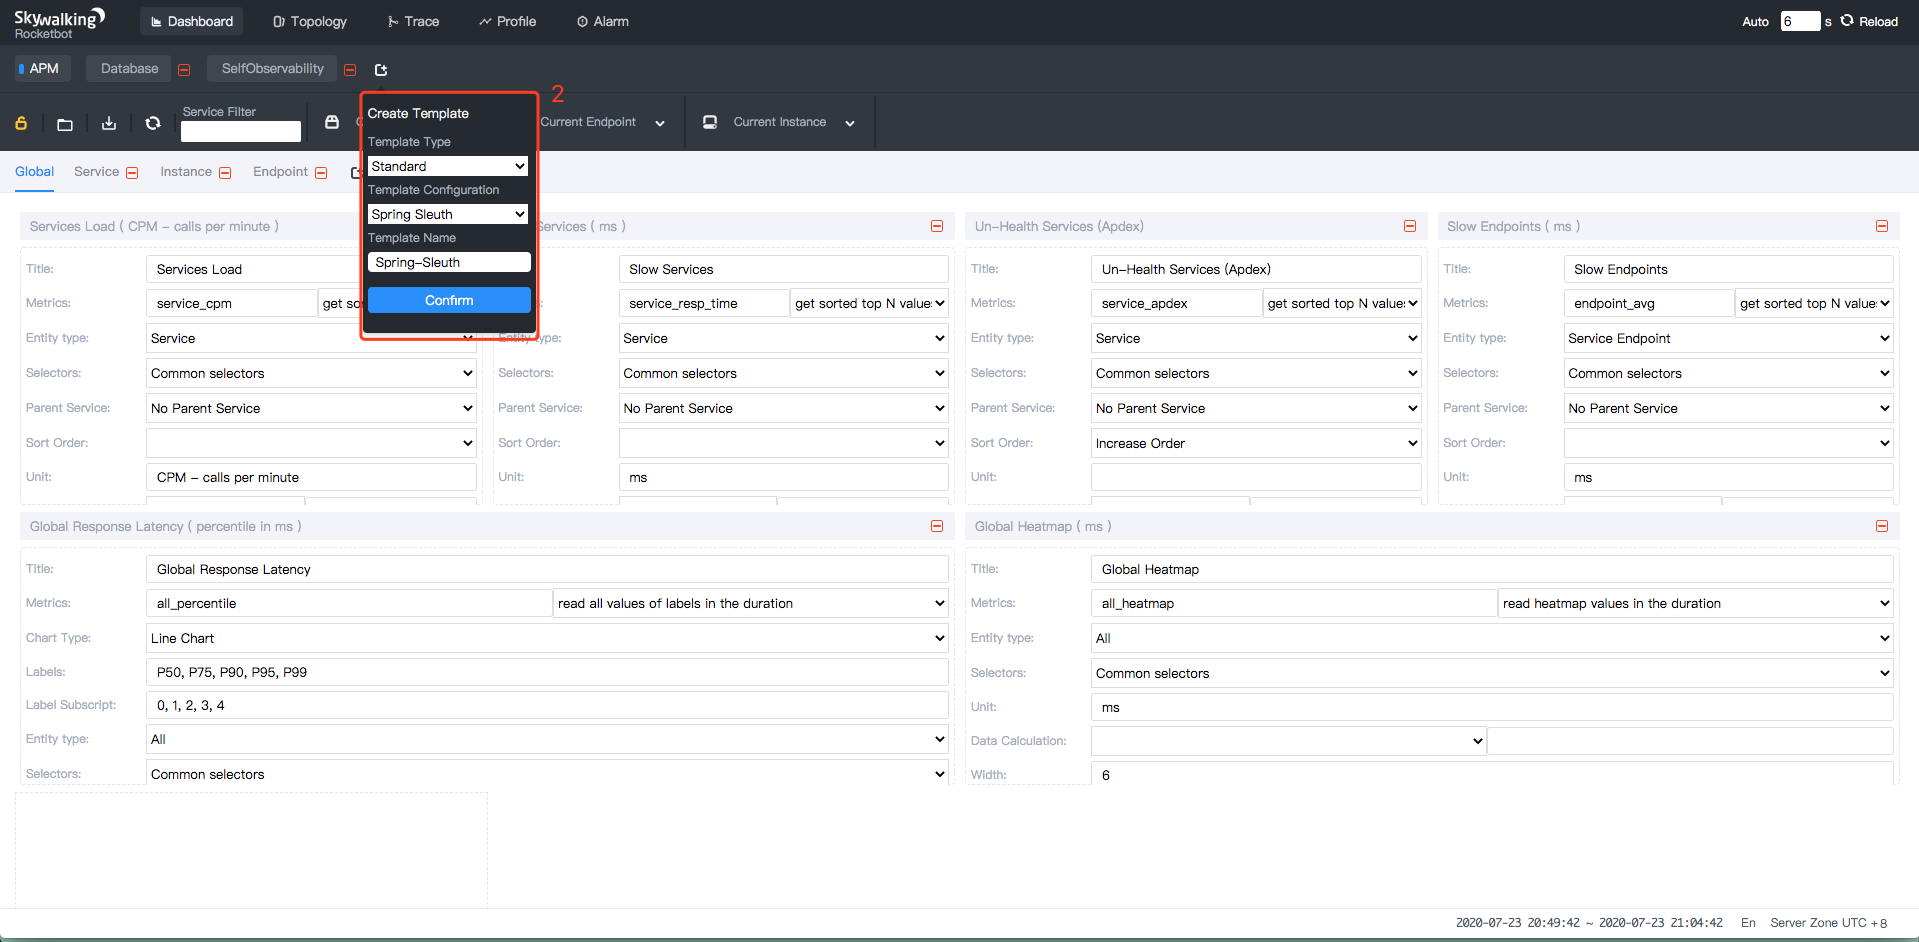
-1. Create a new template. Template type: `Standard` -> Template Configuration:
`Spring` -> Input the Template Name.
-
- 
-
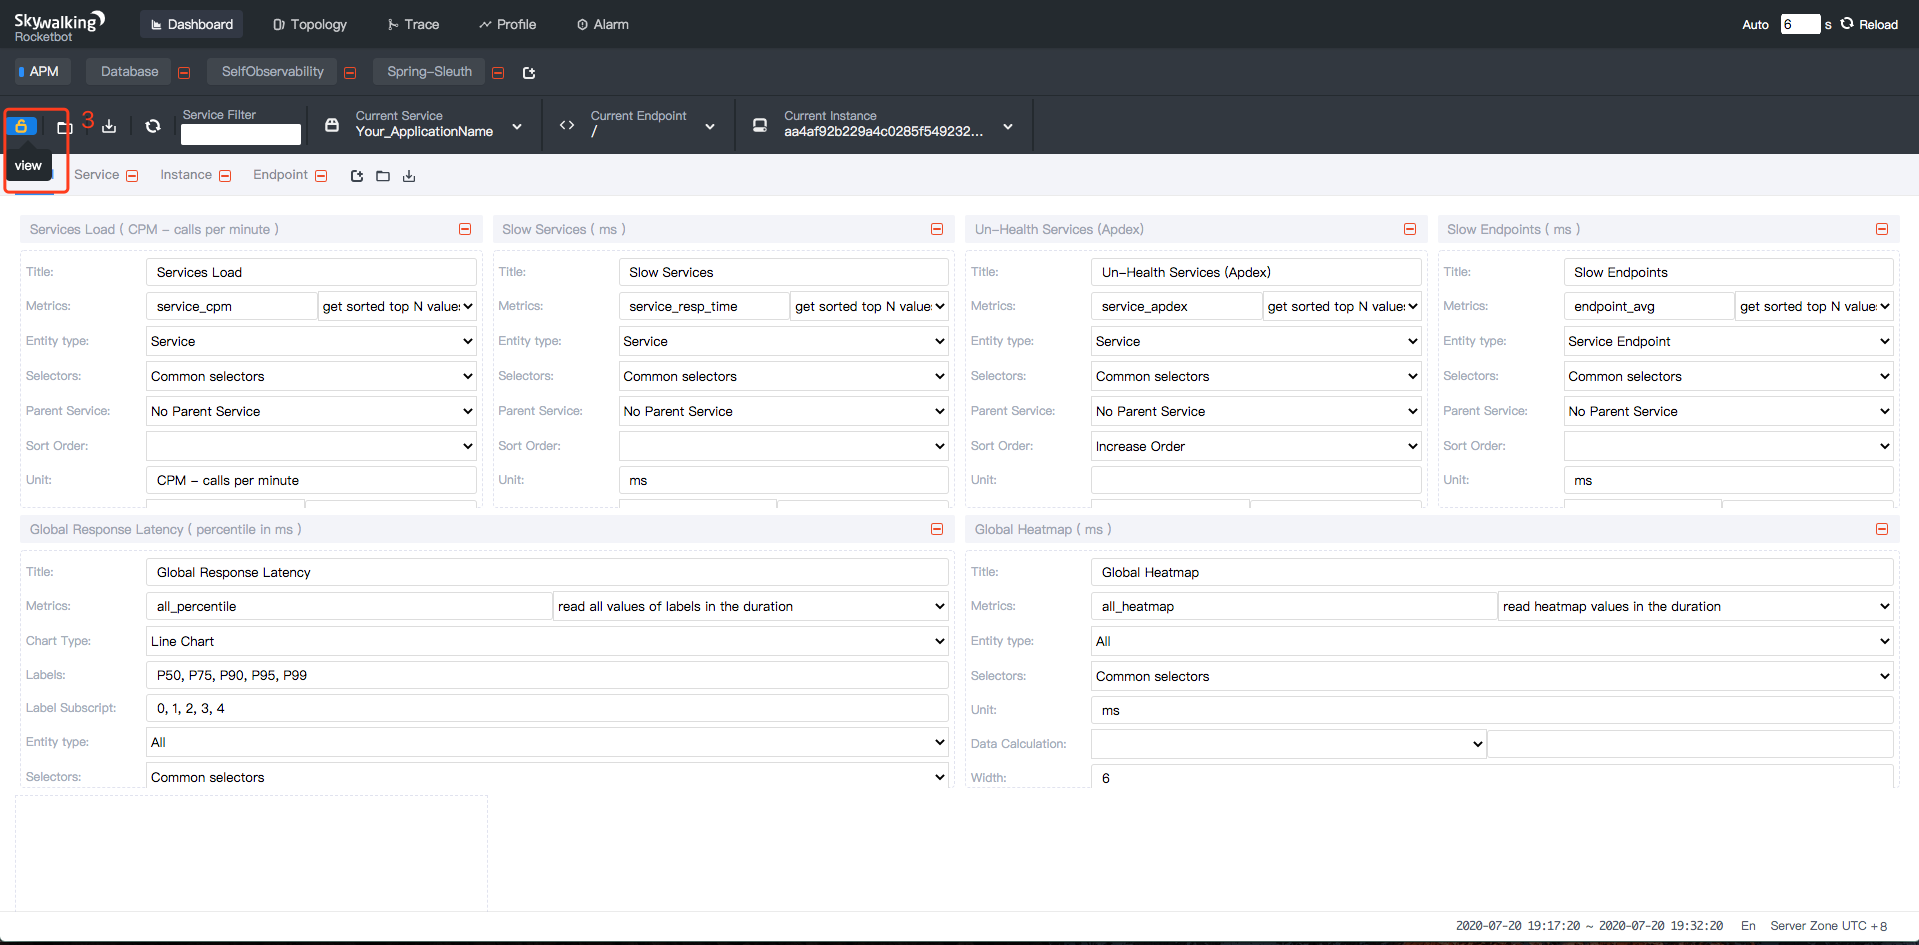
-1. Click `view` button. You'll see the spring sleuth dashboard.
-
- 
- 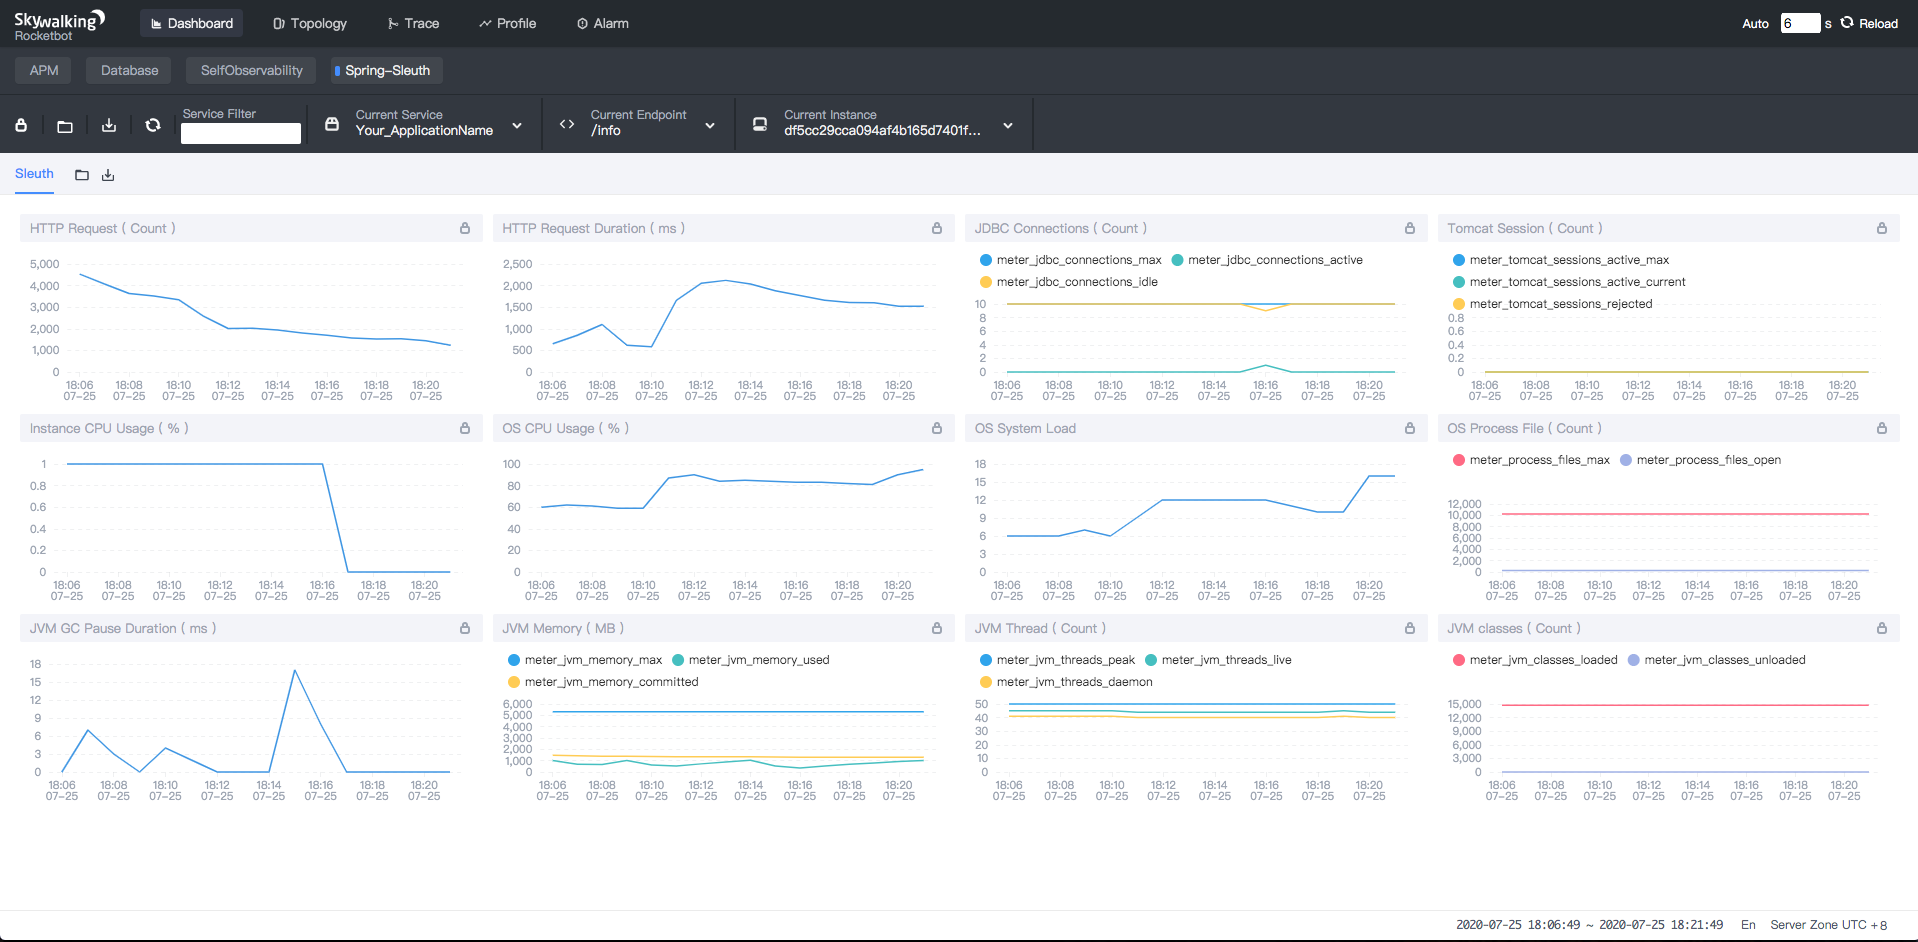
+SkyWalking provides the Spring Sleuth dashboard by default under the general
service instance, which contains the metrics provided by Spring Sleuth by
default.
+Once you have added customized metrics in the application and configuration
the meter config file in the backend. Please following
+the [customized dashboard documentation](../../ui/README.md#metrics) to add
the metrics in the dashboard.
## Supported meter
diff --git a/docs/en/ui/README.md b/docs/en/ui/README.md
index dc9e5ee34e..fb5d537b01 100644
--- a/docs/en/ui/README.md
+++ b/docs/en/ui/README.md
@@ -24,7 +24,32 @@ so).
**Notice, dashboard editable is disabled on release; set system
env(**SW_ENABLE_UPDATE_UI_TEMPLATE=true**) to activate
them.** Before you save the edited dashboard, it is just stored in memory.
Closing a tab would **LOSE** the change permanently.
-There are some calculations for metric values in the dashboard.
+### Widget
+
+The widget provides the ability to visualize the metrics, generated through
[OAL](../concepts-and-designs/mal.md), [MAL](../concepts-and-designs/mal.md),
or [LAL](../concepts-and-designs/lal.md) scripts.
+
+<img
src="https://skywalking.apache.org/screenshots/9.2.0/customize-dashboard-metrics-20220817-configuration.png";
/>
+
+#### Metrics
+
+To display one or more metrics in a graph, the following information is
required:
+1. **Name**: The name of the metric.
+2. **Data Type**: The way of reading the metrics data according to various
metric types.
+3. **Visualization**: The graph options to visualize the metric. Each data
type has its own matched graph options. See the [mapping doc](#common-graphs)
for more details.
+4. **Unit**: The unit of the metrics data.
+5. **Calculation**: The calculation formula for the metric. The available
formulas are [here](#calculations).
+
+##### Common Graphs
+
+|Metrics Data Type|Visualization|Demo|
+|----|-------------|----|
+|read all values in the duration|Line|<img
src="https://skywalking.apache.org/screenshots/9.2.0/customize-dashboard-metrics-20220817-line.png";
/>|
+|get sorted top N values|Top List|<img
src="https://skywalking.apache.org/screenshots/9.2.0/customize-dashboard-metrics-20220817-topn.png";
/>|
+|read all values of labels in the duration|Table|<img
src="https://skywalking.apache.org/screenshots/9.2.0/customize-dashboard-metrics-20220817-tables.png";
/>|
+|read all values in the duration|Area|<img
src="https://skywalking.apache.org/screenshots/9.2.0/customize-dashboard-metrics-20220817-area.png";
/>|
+|read all values in the duration|Service/Instance/Endpoint List|<img
src="https://skywalking.apache.org/screenshots/9.2.0/customize-dashboard-metrics-20220817-entity-table.png";
/>|
+
+##### Calculations
|Label|Calculation|
|----|----|
@@ -42,6 +67,26 @@ There are some calculations for metric values in the
dashboard.
|Milliseconds to seconds|Value / 1000|
|Seconds to days|Value / 86400|
+#### Graph styles
+
+Graph advanced style options.
+
+#### Widget options
+
+<img
src="https://skywalking.apache.org/screenshots/9.2.0/customize-dashboard-metrics-20220817-options.png";
/>
+
+Define the following properties of the widget:
+1. **Name**: The name of the widget, which used to [associate with other
widget](#association-options) in the dashboard.
+2. **Title**: The title name of the widget.
+3. **Tooltip Content**: Additional explanation of the widget.
+
+#### Association Options
+
+<img
src="https://skywalking.apache.org/screenshots/9.2.0/customize-dashboard-metrics-20220817-association.png";
/>
+
+Widget provides the ability to associate with other widgets to show axis
pointer with tips for the same time point, in order to help users to understand
+the connectivity among metrics.
+
## Settings
Settings provide language, server time zone, and auto-fresh options. These
settings are stored in the browser's local storage. Unless you clear them
manually, those will not change.
diff --git
a/oap-server/server-starter/src/main/resources/ui-initialized-templates/general/general-instance.json
b/oap-server/server-starter/src/main/resources/ui-initialized-templates/general/general-instance.json
index 9387f15acb..d29f4aaaa9 100644
---
a/oap-server/server-starter/src/main/resources/ui-initialized-templates/general/general-instance.json
+++
b/oap-server/server-starter/src/main/resources/ui-initialized-templates/general/general-instance.json
@@ -642,6 +642,376 @@
"label": "0-4-11"
}
]
+ },
+ {
+ "name": "Spring Sleuth",
+ "children": [
+ {
+ "x": 0,
+ "y": 0,
+ "w": 6,
+ "h": 12,
+ "i": "0",
+ "type": "Widget",
+ "metricTypes": [
+ "readMetricsValues"
+ ],
+ "metrics": [
+ "meter_http_server_requests_count"
+ ],
+ "graph": {
+ "type": "Line",
+ "step": false,
+ "smooth": false,
+ "showSymbol": false,
+ "showXAxis": true,
+ "showYAxis": true
+ },
+ "widget": {
+ "title": "HTTP Request (Count)"
+ },
+ "value": "0-5-0",
+ "label": "0-5-0"
+ },
+ {
+ "x": 6,
+ "y": 0,
+ "w": 6,
+ "h": 12,
+ "i": "1",
+ "type": "Widget",
+ "metricTypes": [
+ "readMetricsValues"
+ ],
+ "metrics": [
+ "meter_http_server_requests_duration"
+ ],
+ "graph": {
+ "type": "Line",
+ "step": false,
+ "smooth": false,
+ "showSymbol": false,
+ "showXAxis": true,
+ "showYAxis": true
+ },
+ "widget": {
+ "title": "HTTP Request Duration (ms)"
+ },
+ "value": "0-5-1",
+ "label": "0-5-1",
+ "associate": [
+ ]
+ },
+ {
+ "x": 6,
+ "y": 12,
+ "w": 6,
+ "h": 12,
+ "i": "2",
+ "type": "Widget",
+ "metricTypes": [
+ "readMetricsValues"
+ ],
+ "metrics": [
+ "meter_process_cpu_usage"
+ ],
+ "graph": {
+ "type": "Line",
+ "step": false,
+ "smooth": false,
+ "showSymbol": false,
+ "showXAxis": true,
+ "showYAxis": true
+ },
+ "widget": {
+ "title": "Instance CPU Usage (%)"
+ },
+ "value": "0-5-2",
+ "label": "0-5-2"
+ },
+ {
+ "x": 0,
+ "y": 12,
+ "w": 6,
+ "h": 12,
+ "i": "3",
+ "type": "Widget",
+ "metricTypes": [
+ "readMetricsValues"
+ ],
+ "metrics": [
+ "meter_system_cpu_usage"
+ ],
+ "graph": {
+ "type": "Line",
+ "step": false,
+ "smooth": false,
+ "showSymbol": false,
+ "showXAxis": true,
+ "showYAxis": true
+ },
+ "widget": {
+ "title": "OS CPU Usage (%)"
+ },
+ "value": "0-5-3",
+ "label": "0-5-3"
+ },
+ {
+ "x": 12,
+ "y": 0,
+ "w": 6,
+ "h": 12,
+ "i": "4",
+ "type": "Widget",
+ "metricTypes": [
+ "readMetricsValues",
+ "readMetricsValues",
+ "readMetricsValues"
+ ],
+ "metrics": [
+ "meter_jdbc_connections_max",
+ "meter_jdbc_connections_active",
+ "meter_jdbc_connections_idle"
+ ],
+ "graph": {
+ "type": "Line",
+ "step": false,
+ "smooth": false,
+ "showSymbol": false,
+ "showXAxis": true,
+ "showYAxis": true
+ },
+ "widget": {
+ "title": "JDBC Connections (Count)"
+ },
+ "value": "0-5-4",
+ "label": "0-5-4"
+ },
+ {
+ "x": 18,
+ "y": 0,
+ "w": 6,
+ "h": 12,
+ "i": "5",
+ "type": "Widget",
+ "metricTypes": [
+ "readMetricsValues",
+ "readMetricsValues",
+ "readMetricsValues",
+ "readMetricsValues"
+ ],
+ "metrics": [
+ "meter_tomcat_sessions_active_max",
+ "meter_tomcat_sessions_active_current",
+ "meter_tomcat_sessions_rejected"
+ ],
+ "graph": {
+ "type": "Line",
+ "step": false,
+ "smooth": false,
+ "showSymbol": false,
+ "showXAxis": true,
+ "showYAxis": true
+ },
+ "widget": {
+ "title": "Tomcat Session (Count)"
+ },
+ "value": "0-5-5",
+ "label": "0-5-5"
+ },
+ {
+ "x": 12,
+ "y": 12,
+ "w": 6,
+ "h": 12,
+ "i": "6",
+ "type": "Widget",
+ "metricTypes": [
+ "readMetricsValues"
+ ],
+ "metrics": [
+ "meter_system_load_average_1m"
+ ],
+ "graph": {
+ "type": "Line",
+ "step": false,
+ "smooth": false,
+ "showSymbol": false,
+ "showXAxis": true,
+ "showYAxis": true
+ },
+ "widget": {
+ "title": "OS System Load"
+ },
+ "value": "0-5-6",
+ "label": "0-5-6",
+ "associate": [
+ ]
+ },
+ {
+ "x": 18,
+ "y": 12,
+ "w": 6,
+ "h": 12,
+ "i": "7",
+ "type": "Widget",
+ "metricTypes": [
+ "readMetricsValues",
+ "readMetricsValues"
+ ],
+ "metrics": [
+ "meter_process_files_max",
+ "meter_process_files_open"
+ ],
+ "graph": {
+ "type": "Line",
+ "step": false,
+ "smooth": false,
+ "showSymbol": false,
+ "showXAxis": true,
+ "showYAxis": true
+ },
+ "widget": {
+ "title": "OS Process File (Count)"
+ },
+ "value": "0-5-7",
+ "label": "0-5-7",
+ "associate": [
+ ]
+ },
+ {
+ "x": 0,
+ "y": 24,
+ "w": 6,
+ "h": 12,
+ "i": "8",
+ "type": "Widget",
+ "metricTypes": [
+ "readMetricsValues"
+ ],
+ "metrics": [
+ "meter_jvm_gc_pause_duration"
+ ],
+ "graph": {
+ "type": "Line",
+ "step": false,
+ "smooth": false,
+ "showSymbol": false,
+ "showXAxis": true,
+ "showYAxis": true
+ },
+ "widget": {
+ "title": "JVM GC Pause Duration (ms)"
+ },
+ "value": "0-5-8",
+ "label": "0-5-8"
+ },
+ {
+ "x": 6,
+ "y": 24,
+ "w": 6,
+ "h": 12,
+ "i": "9",
+ "type": "Widget",
+ "metricTypes": [
+ "readMetricsValues",
+ "readMetricsValues",
+ "readMetricsValues"
+ ],
+ "metrics": [
+ "meter_jvm_memory_max",
+ "meter_jvm_memory_used",
+ "meter_jvm_memory_committed"
+ ],
+ "graph": {
+ "type": "Line",
+ "step": false,
+ "smooth": false,
+ "showSymbol": false,
+ "showXAxis": true,
+ "showYAxis": true
+ },
+ "associate": [
+ ],
+ "metricConfig": [
+ {
+ "calculation": "byteToMB",
+ "unit": "MB"
+ },
+ {
+ "calculation": "byteToMB",
+ "unit": "MB"
+ },
+ {
+ "calculation": "byteToMB",
+ "unit": "MB"
+ }
+ ],
+ "widget": {
+ "title": "JVM Memory (MB)"
+ },
+ "value": "0-5-9",
+ "label": "0-5-9"
+ },
+ {
+ "x": 12,
+ "y": 24,
+ "w": 6,
+ "h": 12,
+ "i": "10",
+ "type": "Widget",
+ "metricTypes": [
+ "readMetricsValues",
+ "readMetricsValues",
+ "readMetricsValues"
+ ],
+ "metrics": [
+ "meter_jvm_threads_peak",
+ "meter_jvm_threads_live",
+ "meter_jvm_threads_daemon"
+ ],
+ "graph": {
+ "type": "Line",
+ "step": false,
+ "smooth": false,
+ "showSymbol": false,
+ "showXAxis": true,
+ "showYAxis": true
+ },
+ "widget": {
+ "title": "JVM Thread (Count)"
+ },
+ "value": "0-5-10",
+ "label": "0-5-10"
+ },
+ {
+ "x": 18,
+ "y": 24,
+ "w": 6,
+ "h": 12,
+ "i": "11",
+ "type": "Widget",
+ "metricTypes": [
+ "readMetricsValues",
+ "readMetricsValues"
+ ],
+ "metrics": [
+ "meter_jvm_classes_loaded",
+ "meter_jvm_classes_unloaded"
+ ],
+ "graph": {
+ "type": "Line",
+ "step": false,
+ "smooth": false,
+ "showSymbol": false,
+ "showXAxis": true,
+ "showYAxis": true
+ },
+ "widget": {
+ "title": "JVM classes (Count)"
+ }
+ }
+ ]
}
]
},