ryan-quigley opened a new issue #5324: Module 'pandas' has no attribute 'rolling_sum' URL: https://github.com/apache/incubator-superset/issues/5324 Make sure these boxes are checked before submitting your issue - thank you! - [x] I have checked the superset logs for python stacktraces and included it here as text if any - [x] I have reproduced the issue with at least the latest released version of superset - [x] I have checked the issue tracker for the same issue and I haven't found one similar Seems newer versions of pandas use `pd.rolling().sum()` instead of `pd.rolling_sum()` ### Superset version superset: 0.25.6 pandas: 0.23.1 ### Expected results Charts produced with rolling computations (mean, sum, std) ### Actual results Charts are empty except following message: `module 'pandas' has no attribute 'rolling_sum'` 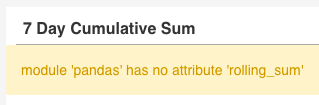 Webserver log: ``` 2018-07-01 11:54:45,902:ERROR:root:module 'pandas' has no attribute 'rolling_sum' Traceback (most recent call last): File "/root/.local/share/virtualenvs/superset_env-U7Y-keoc/lib/python3.5/site-packages/superset/views/core.py", line 1107, in generate_json payload = viz_obj.get_payload() File "/root/.local/share/virtualenvs/superset_env-U7Y-keoc/lib/python3.5/site-packages/superset/viz.py", line 329, in get_payload payload['data'] = self.get_data(df) File "/root/.local/share/virtualenvs/superset_env-U7Y-keoc/lib/python3.5/site-packages/superset/viz.py", line 1194, in get_data df = self.process_data(df) File "/root/.local/share/virtualenvs/superset_env-U7Y-keoc/lib/python3.5/site-packages/superset/viz.py", line 1150, in process_data df = pd.rolling_sum(**kwargs) AttributeError: module 'pandas' has no attribute 'rolling_sum' ``` ### Steps to reproduce #### Datasource & Chart Type * Vizualization Type: Time Series - Line Chart #### Advanced Analytics * Rolling: mean, sum, or std * Periods: 7 * Min Periods: 7 * Period Ratio Type: value
----------------------------------------------------------------
This is an automated message from the Apache Git Service.
To respond to the message, please log on GitHub and use the
URL above to go to the specific comment.

For queries about this service, please contact Infrastructure at:
[email protected]


With regards,
Apache Git Services

---------------------------------------------------------------------
To unsubscribe, e-mail: [email protected]
For additional commands, e-mail: [email protected]