ecdavis commented on issue #6070: Specifying Date range for a chart URL: https://github.com/apache/incubator-superset/issues/6070#issuecomment-437460709 Adding more info around this issue. ## Bar chart viz scoped to last day includes data from last two days ### Superset version This SHA: https://github.com/lyft/incubator-superset/tree/50aca10b85b12191643e97341559bab382c0e584 ### Expected results A bar chart scoped to the last day using the time controls should only display data from the last day. The query used for the chart should be: ``` SELECT column_name AS column_name, COUNT(*) AS count FROM public.table_name WHERE snapshot_date > '2018-11-08 00:00:00' AND snapshot_date <= '2018-11-09 00:00:00' GROUP BY column_name ORDER BY count DESC LIMIT 50000; ``` ### Actual results A bar chart scoped to the last day using the time controls displays data from the last two days. The query used for the chart is: ``` SELECT column_name AS column_name, COUNT(*) AS count FROM public.table_name WHERE snapshot_date >= '2018-11-08 00:00:00' AND snapshot_date <= '2018-11-09 00:00:00' GROUP BY column_name ORDER BY count DESC LIMIT 50000; ``` ### Steps to reproduce We use a PostgreSQL datasource. Our table has a column "snapshot_date" which has a type of DATE. We have multiple rows with the same "snapshot_date" value and want to create a bar chart which counts the number of rows in the last day. This problem is exacerbated when using the DATE column type, because date comparisons ignore times. `'2018-11-08' >= '2018-11-08 hh:mm:ss'` will always evaluate to true, regardless of the value of hh, mm, or ss because the date parts are equal. Similarly, `'2018-11-09' <= '2018-11-09 hh:mm:ss'` will always evaluate to true, regardless of the value of hh, mm, or ss because the date on the left is less than the date on the right. This is also a problem when using the TIMESTAMP column type, however, because the time window superset is currently producing is 86401 seconds (1 day + 1 second), rather than 86400 seconds (1 day). ### Screenshots Viz type and time controls on chart.  Actual behavior: 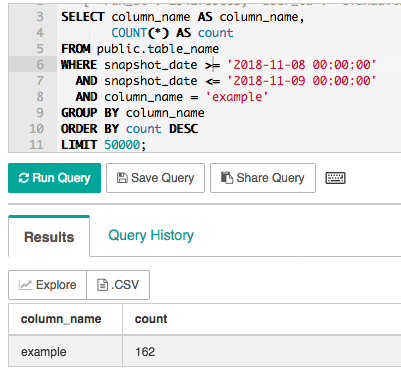 Expected behavior: 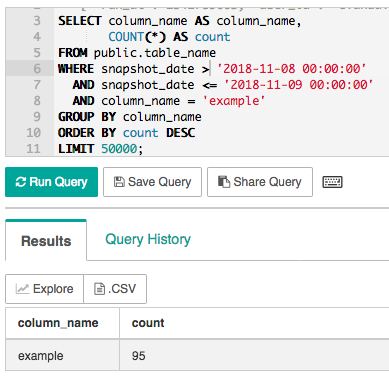
----------------------------------------------------------------
This is an automated message from the Apache Git Service.
To respond to the message, please log on GitHub and use the
URL above to go to the specific comment.

For queries about this service, please contact Infrastructure at:
[email protected]


With regards,
Apache Git Services

---------------------------------------------------------------------
To unsubscribe, e-mail: [email protected]
For additional commands, e-mail: [email protected]