Timonzimm opened a new issue #15525:
URL: https://github.com/apache/superset/issues/15525
A clear and concise description of what the bug is. ### Expected results I expect to be able to create an histogram of metrics but only "COLUMNS" can be selected. ### Actual results Only COLUMNS can be selected when choosing "Histogram" visualization type. #### Screenshots 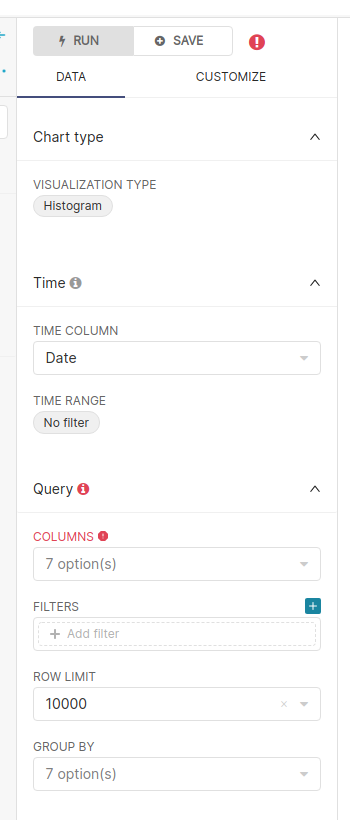 ### Environment I am using the docker-compose `non-dev.yml` file. - superset version: `Superset 0.999.0dev` - python version: `Python 3.7.9` - node.js version: `bash: node: command not found` ### Checklist Make sure to follow these steps before submitting your issue - thank you! - [X] I have checked the superset logs for python stacktraces and included it here as text if there are any. - [X ] I have reproduced the issue with at least the latest released version of superset. - [ X] I have checked the issue tracker for the same issue and I haven't found one similar. ### Additional context Add any other context about the problem here. -- This is an automated message from the Apache Git Service. To respond to the message, please log on to GitHub and use the URL above to go to the specific comment. To unsubscribe, e-mail: [email protected] For queries about this service, please contact Infrastructure at: [email protected] --------------------------------------------------------------------- To unsubscribe, e-mail: [email protected] For additional commands, e-mail: [email protected]