andrewscarani opened a new issue #15561:
URL: https://github.com/apache/superset/issues/15561
**Is your feature request related to a problem? Please describe.** When applying a `GROUP BY` value to a Time-series (Bar) Chart, the hover tooltip only shows the value of the single grouped total, not the total bar. This same issue applies when viewing the `Mixed Time-series Chart` as well as the `Pie Chart`... Without showing a value for the total, it's a bit difficult to understand composition/scale of the group out of the total.  **Describe the solution you'd like** Whenever `GROUP BY` is applied to a chart, the tooltip should show the total value at the time period hovered, **in addition** to the existing grouped-total value. E.g. from Chartio: 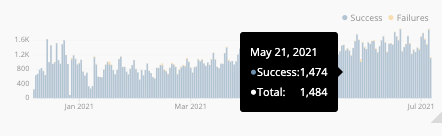 **Describe alternatives you've considered** Current workaround is to combine a bar series with a "total" line series in the `Mixed Time-series Chart`, but this is a hassle to do each and every time. Also, because the Mixed Time-Series Chart only allows for two mixed series, it wastes a series that could potentially be more valuable than the total (such as viewing year-over-year growth) 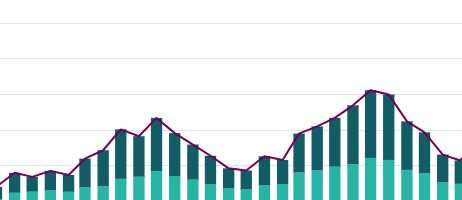 -- This is an automated message from the Apache Git Service. To respond to the message, please log on to GitHub and use the URL above to go to the specific comment. To unsubscribe, e-mail: [email protected] For queries about this service, please contact Infrastructure at: [email protected] --------------------------------------------------------------------- To unsubscribe, e-mail: [email protected] For additional commands, e-mail: [email protected]