ValentinC-BR opened a new issue #16747:
URL: https://github.com/apache/superset/issues/16747
**Is your feature request related to a problem? Please describe.** The boxplot currently needs a user-defined axis range (see this feature request : https://github.com/apache/superset/issues/16745 ) However, this will only partially solve the problem. For better data exploration, providing the user with a slider to manually zoom in the y-axis would be a great enhancement. <br> **Describe the solution you'd like** Add an option in the "Customize" panel :  When set to True, this display a vertical range slider (next to the y-axis) like this : 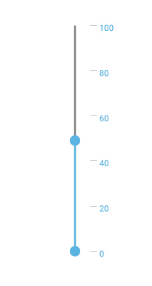 <br> **Describe alternatives you've considered** Range sliders like the x-axis zoom options in line charts can also be a solution, but would take too much space : 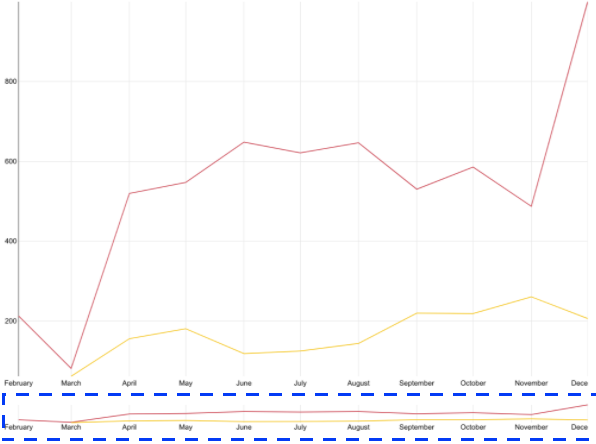 **Additional context** / -- This is an automated message from the Apache Git Service. To respond to the message, please log on to GitHub and use the URL above to go to the specific comment. To unsubscribe, e-mail: [email protected] For queries about this service, please contact Infrastructure at: [email protected] --------------------------------------------------------------------- To unsubscribe, e-mail: [email protected] For additional commands, e-mail: [email protected]