scimas opened a new issue #17190:
URL: https://github.com/apache/superset/issues/17190
Specifically, histogram seems to replace `-`s (hyphens) in the lables with `_`s (underscores). Which means the same group by labels get different colours in different charts in the same dashboard. #### How to reproduce the bug 1. Have a column in a dataset with hyphens in the values. 2. Use said column for Group By in a line chart and in a histogram. ### Expected results Both the line chart and histogram create same labels in the legend. ### Actual results They don't create the same labels in the legend, histogram seems to replace hyphens with underscores. #### Screenshots Line chart: 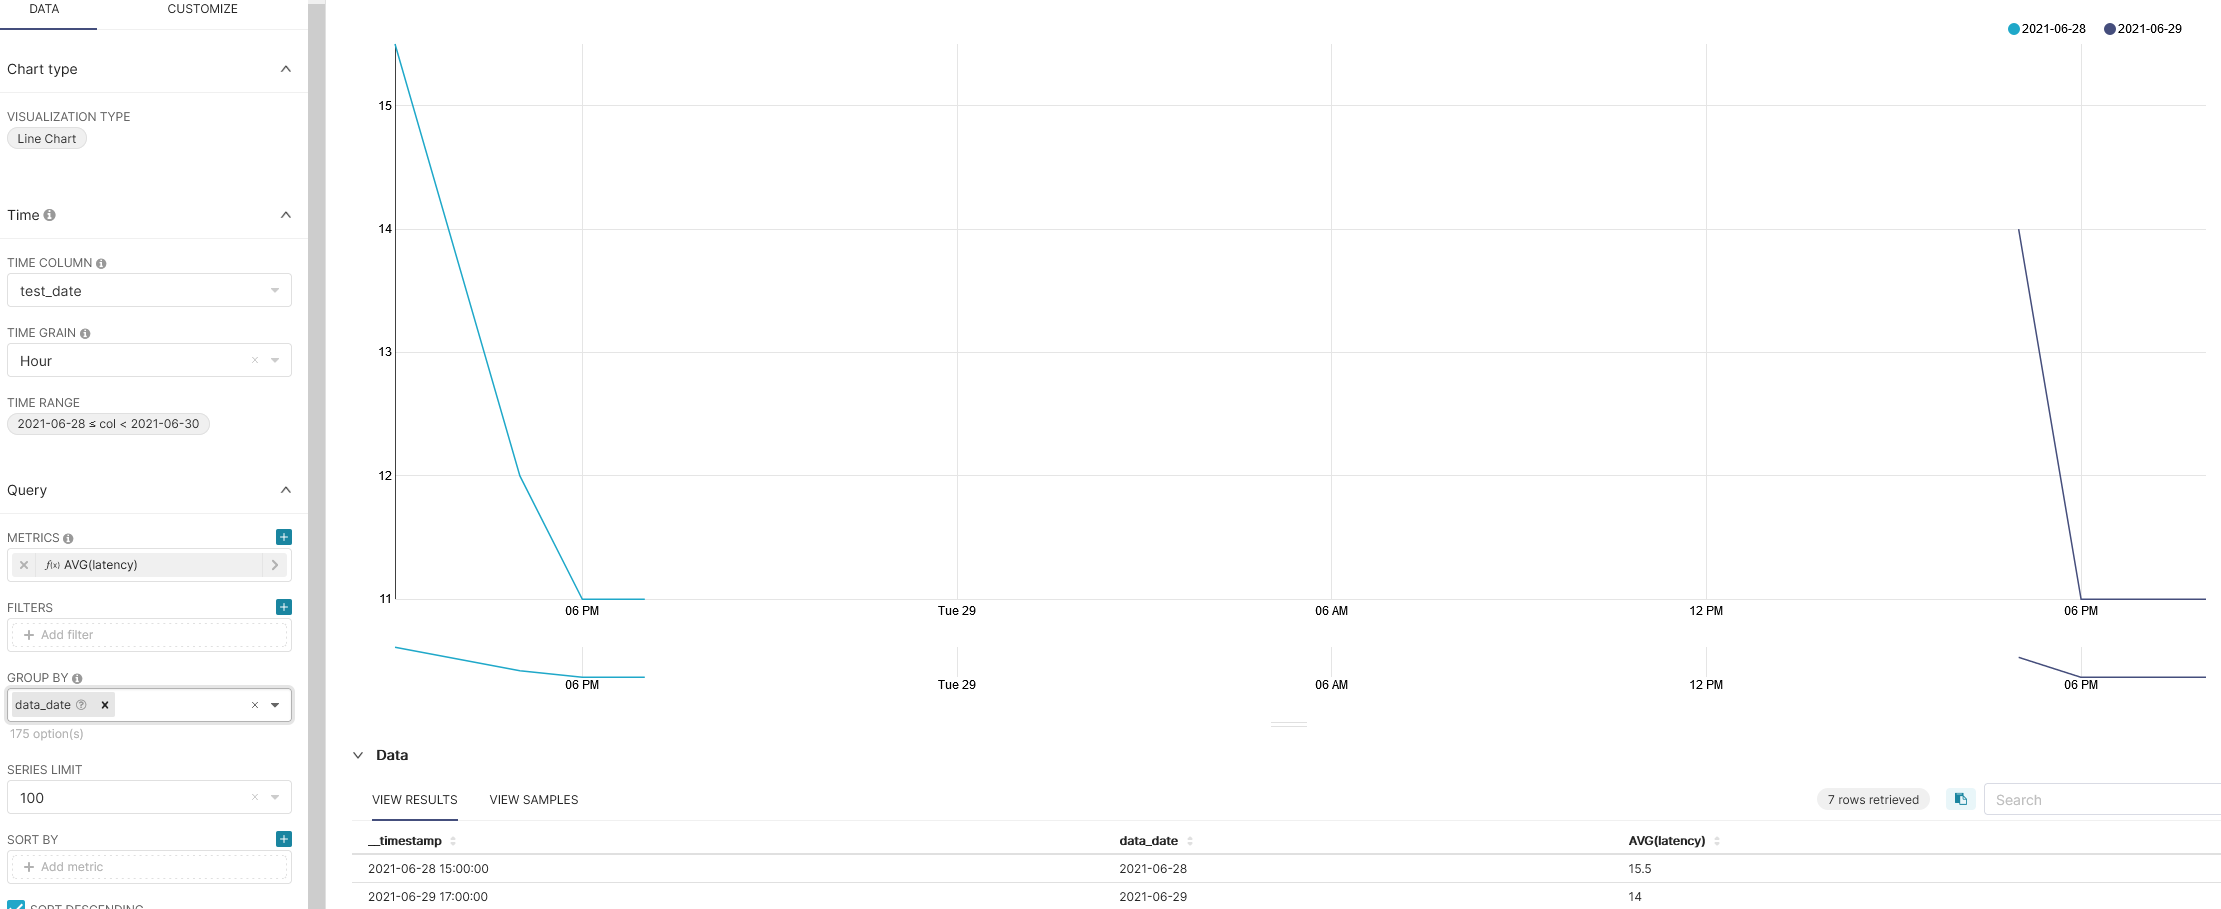 Histogram: 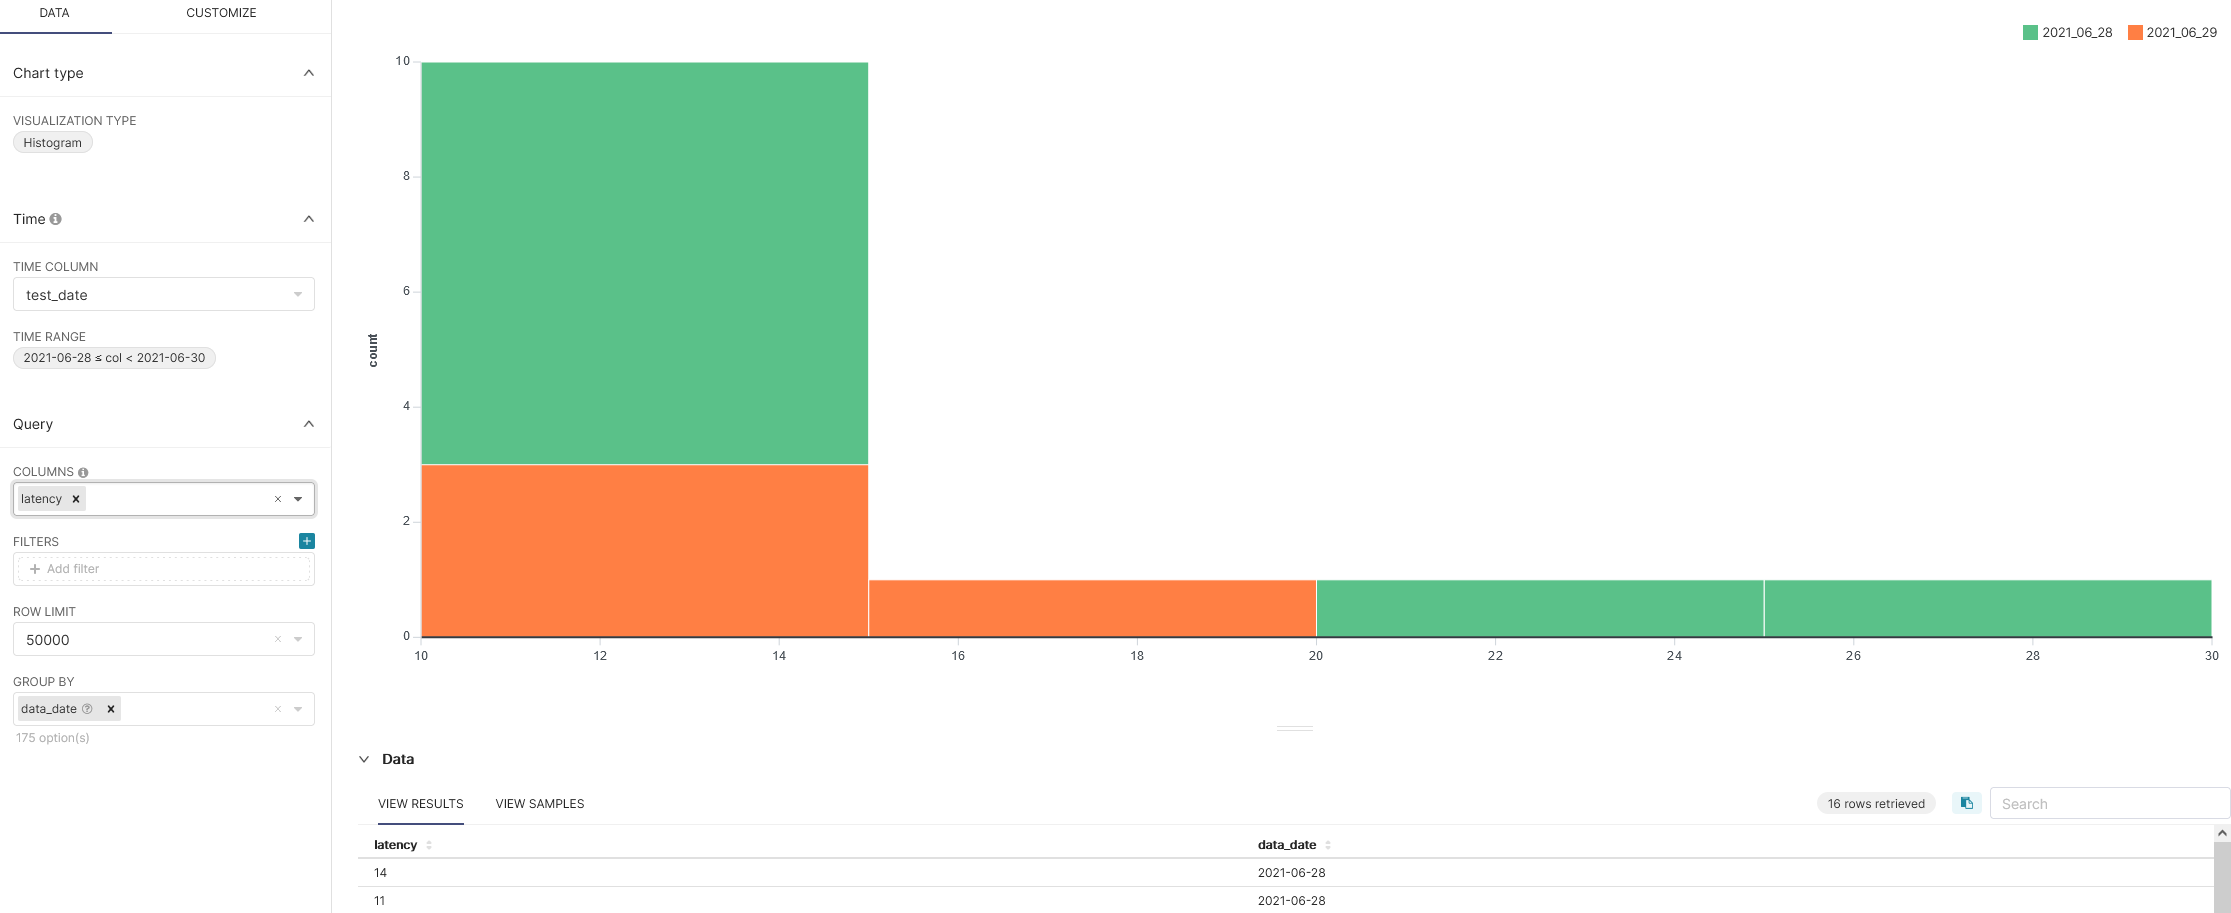 ### Environment - Firefox 93.0: - superset version: `1.3.2` - python version: `3.7.9` ### Checklist Make sure to follow these steps before submitting your issue - thank you! - [ ] I have checked the superset logs for python stacktraces and included it here as text if there are any. - [x] I have reproduced the issue with at least the latest released version of superset. - [x] I have checked the issue tracker for the same issue and I haven't found one similar. ### Additional context -- This is an automated message from the Apache Git Service. To respond to the message, please log on to GitHub and use the URL above to go to the specific comment. To unsubscribe, e-mail: [email protected] For queries about this service, please contact Infrastructure at: [email protected] --------------------------------------------------------------------- To unsubscribe, e-mail: [email protected] For additional commands, e-mail: [email protected]