comdiv opened a new issue, #20558:
URL: https://github.com/apache/superset/issues/20558
While same filters are applyed to all charts of the dashboard - different charts shown different count of filters #### How to reproduce the bug 1. Open `Sales dashboard` example 2. Go to `Exploratory` tab 3. Set `Time Range Filter` and `Product Line Filter` 4. Back to `Sales overview` 5. All charts shows same `2 filters applyed` 6. Go to `Exploratory` 7. Reset `Time Range Filter` to `No filter` 8. Back to `Sales overview` 9. Some of charts show expected `1 filter`, but some still show `2 filter` ### Expected results Same filter setting would cause same visible indicataion ### Actual results Filter apply indication is not based just on filters itself, but has some entropy due to chart type (?) #### Screenshots 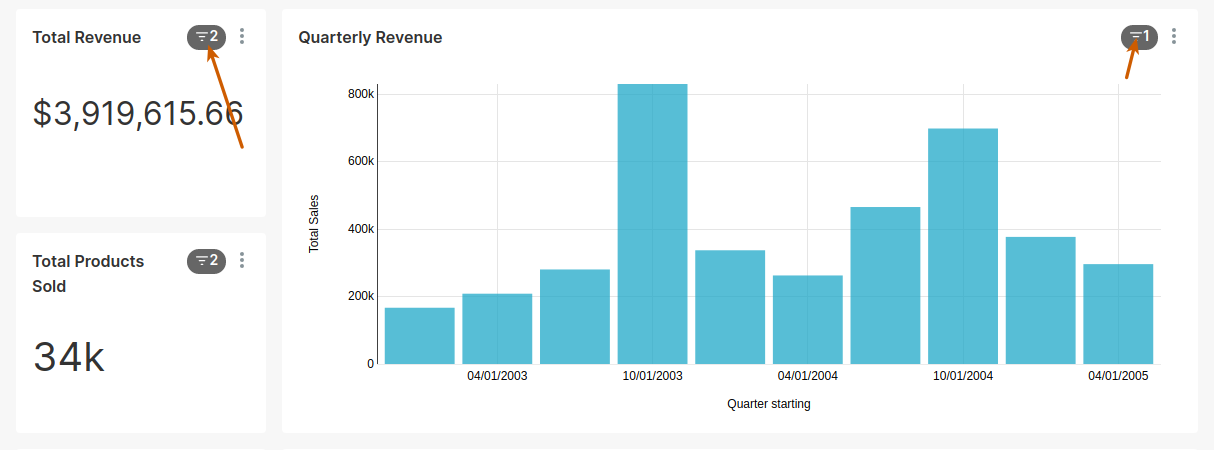 -- This is an automated message from the Apache Git Service. To respond to the message, please log on to GitHub and use the URL above to go to the specific comment. To unsubscribe, e-mail: [email protected] For queries about this service, please contact Infrastructure at: [email protected] --------------------------------------------------------------------- To unsubscribe, e-mail: [email protected] For additional commands, e-mail: [email protected]