goto-loop opened a new issue, #21328:
URL: https://github.com/apache/superset/issues/21328
When using the Gauge chart, it is possible to define interval bounds and interval colors, e.g. for marking a range of "good" values. It is also possible to set minimum and maximum values to define the left and right boundaries of the Gauge. When interval bounds and colors are in place and then a min value is set, the position of the interval color boundary does not change. #### How to reproduce the bug 1. Create a new Gauge chart, e.g. with exported_stats example dataset 2. Select AVG(daily_members_posting_messages) as Metric 3. On Customize tab, set INTERVAL BOUNDS to 10, 16.53 and INTERVAL COLORS to 3, 6 4. Set MIN to 8 5. Observe how the boundary between green and red does not move when MIN is updated ### Expected results The color boundary should move to a new position depending on the value of MIN. ### Actual results The color boundary stays where it was when MIN was 0. #### Screenshots Without MIN value set: 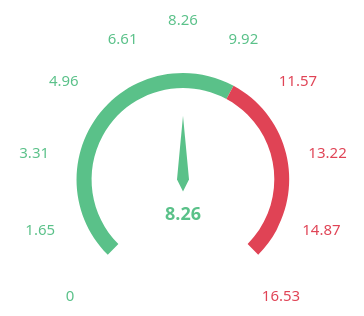 With MIN value set:  ### Environment - browser type and version: Firefox 104.0.1 - superset version: 2.0.0 ### Checklist Make sure to follow these steps before submitting your issue - thank you! - [N/A] I have checked the superset logs for python stacktraces and included it here as text if there are any. - [x] I have reproduced the issue with at least the latest released version of superset. - [x] I have checked the issue tracker for the same issue and I haven't found one similar. -- This is an automated message from the Apache Git Service. To respond to the message, please log on to GitHub and use the URL above to go to the specific comment. To unsubscribe, e-mail: [email protected] For queries about this service, please contact Infrastructure at: [email protected] --------------------------------------------------------------------- To unsubscribe, e-mail: [email protected] For additional commands, e-mail: [email protected]