javidov opened a new issue #11767:
URL: https://github.com/apache/incubator-superset/issues/11767
After creating a **table visualization** in "Explore view", I can change the
"**time grain**" after checking **"Include Time"** and see the displayed
results with correct **Datetime** formats (**"Table Timestamp Format"** is set
to **"Adaptative formating"**). Next I added the **saved table chart** to a
**"dashboard"** along with a **"filter_box"** created to provide the ability to
change the **"time grain"** of **Datetime** (noted as **Time**) column of the
table viz. However when I choose a **"time grain" from the "filter"box"**, the
new **Datetime format of Time column** corresponding to **new** "time grain" is
**incorrectly displayed**.
New fetched records are displayed with **"Time" column format**
corresponding to the initial **"time_grain_sqla"** format saved in **chart
metadata** after saving the chart from the **"Explore view"**.
### Expected results
**"Time" column format** change in dashboard after changing **"time grain"**
value from **filter_box.**
### Actual results
Records are correctly fetched from database (**clickhouse**), but the
displayed **Datetime format** in **"Time" column** are based on **"time grain"
set after creating and saving table viz from "Explore view".**
#### Screenshots
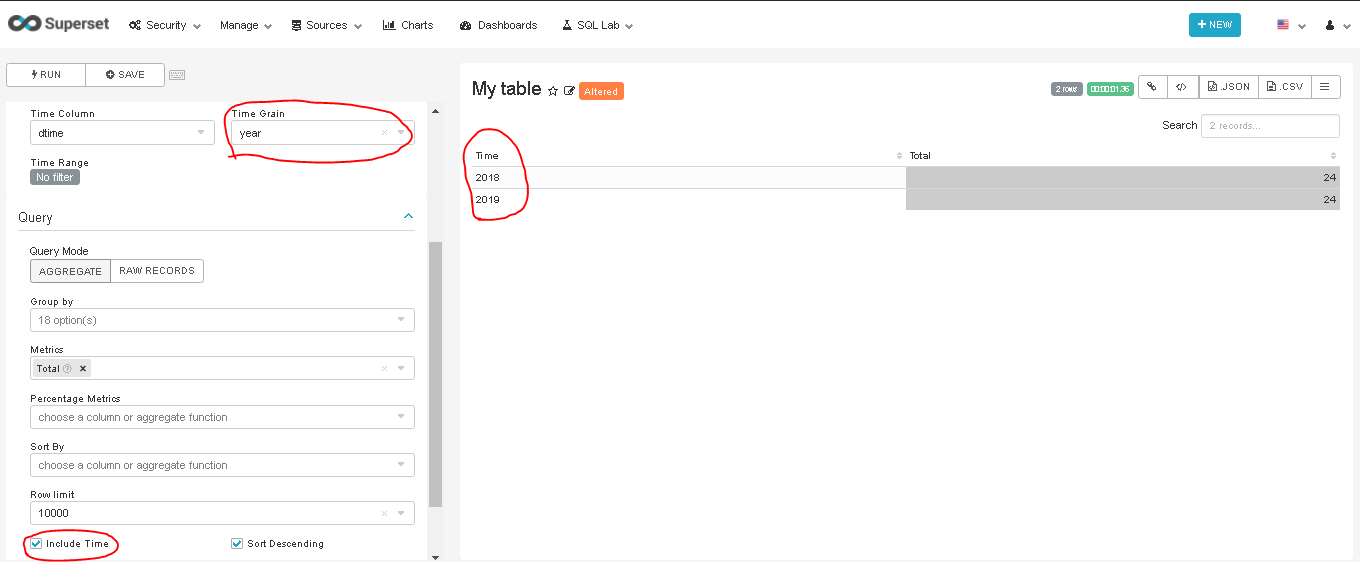
This is when I set "time grain" to **year** in Explore view, results are
correct
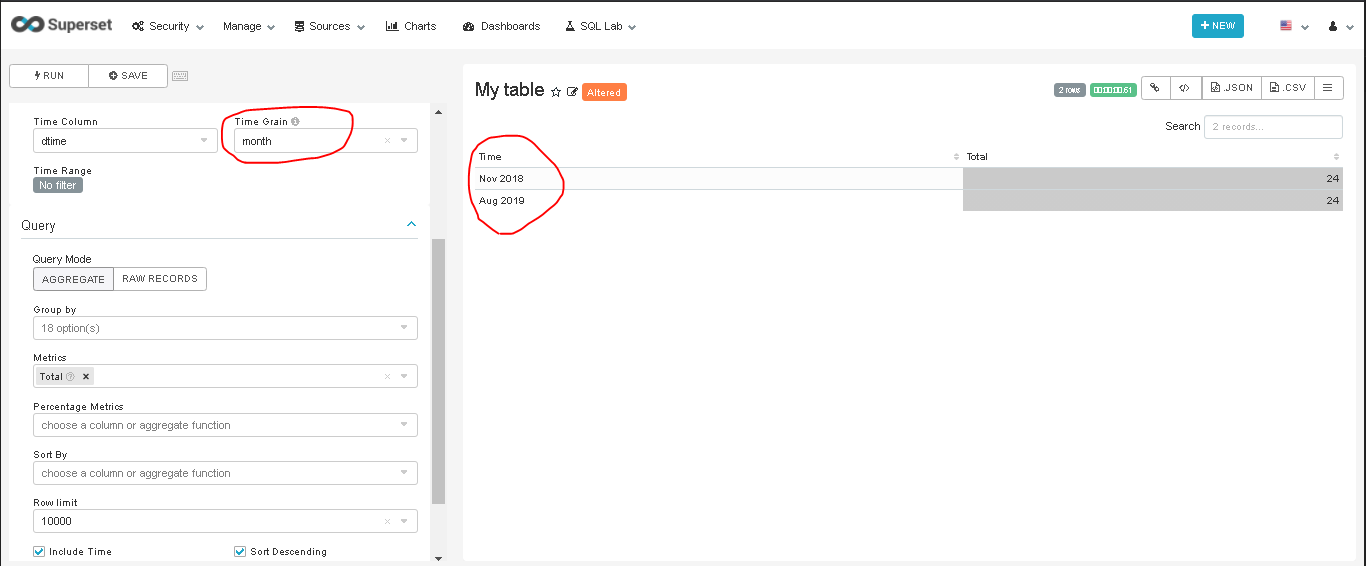
This is when I set "time grain" to **month** in Explore view, results are
correct. **The chart is **SAVED** with month as time grain.**
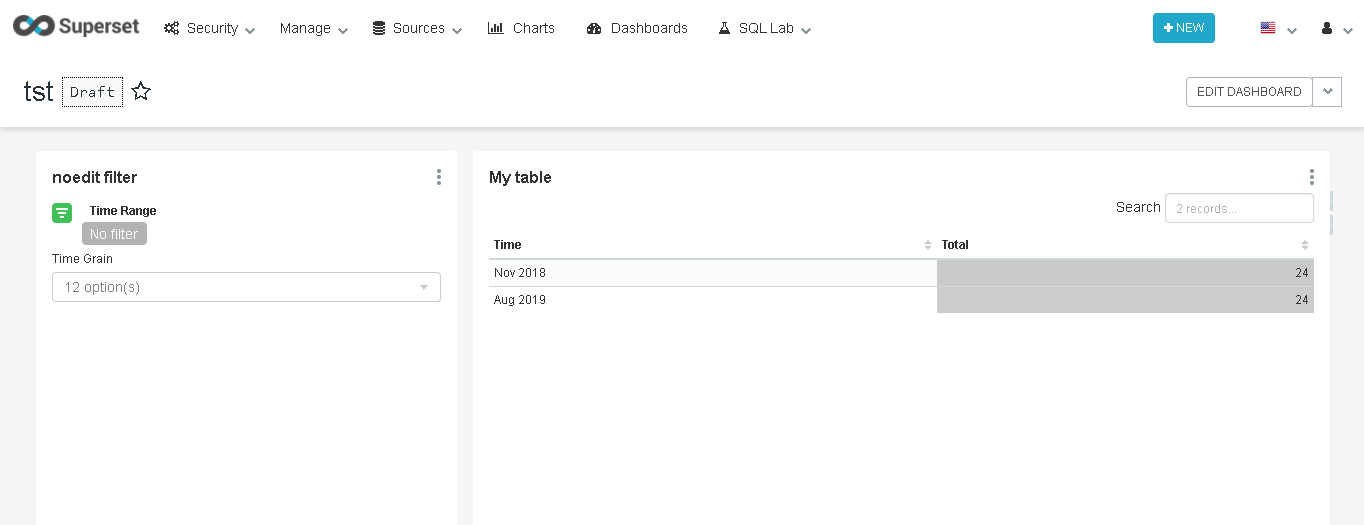
This is the **initial view from the dashboard**. The table is displayed with
**"time grain" equal to month** (table viz is saved with month time grain in
explore view).
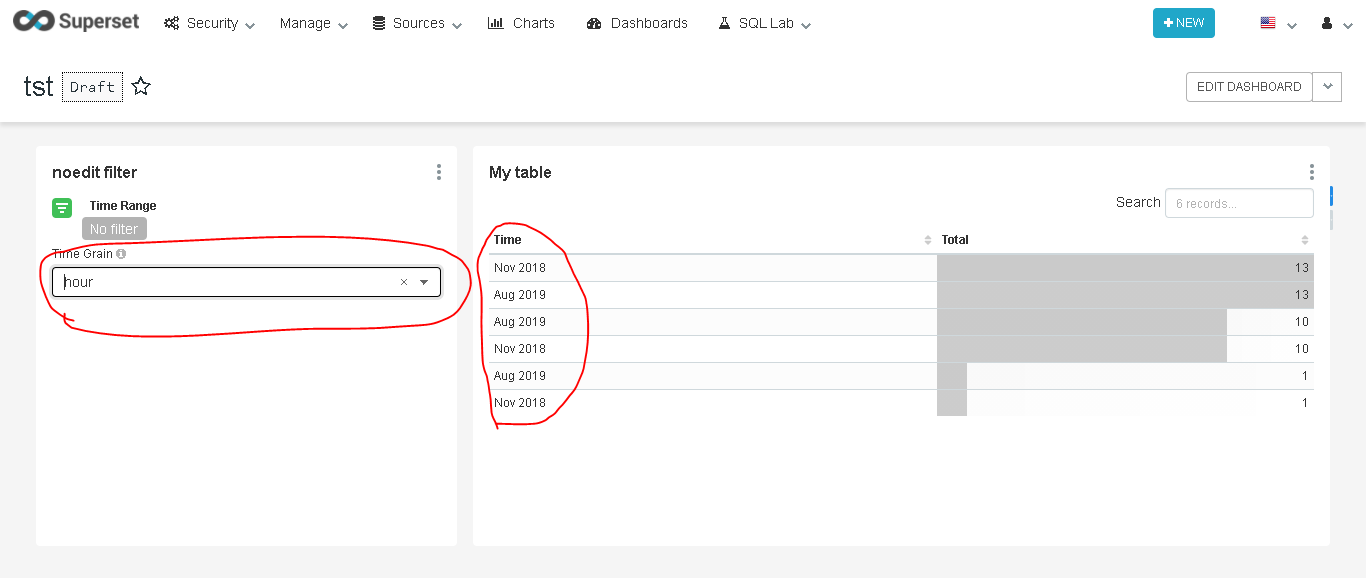
When new **"Time grain" is selected** from "Time grain" **dropdown of
filter_box,** records are fetched successfully, but **Datetime format for
"Time" column is incorrect**.
This is the expected results in **Dashboard** (as seen in explore view).

#### How to reproduce the bug
1. **Create** table visualization.
2. Choose **"Include time"**.
3. Select metrics to display.
4. Select a **"Time grain"** from **"Time related form attributes"**
5. **Save** the chart.
6. Create **Filter_box** viz, check **"the Show SQL Granularity Dropdown"**
7. Add table and filter_box viz to a dashboard and select a "Time grain"
value from filter_box dropdown
### Environment
(please complete the following information):
- superset version: `0.37.2`
- python version: `2.7.17`
- Clickhouse version : `19.17.6.36`
- Ubuntu version : `Ubuntu 18.04.5`
### Checklist
Make sure to follow these steps before submitting your issue - thank you!
- [ ] I have checked the superset logs for python stacktraces and included
it here as text if there are any.
- [ ] I have reproduced the issue with at least the latest released version
of superset.
- [ ] I have checked the issue tracker for the same issue and I haven't
found one similar.
### Additional context
Add any other context about the problem here.
----------------------------------------------------------------
This is an automated message from the Apache Git Service.
To respond to the message, please log on to GitHub and use the
URL above to go to the specific comment.
For queries about this service, please contact Infrastructure at:
[email protected]
---------------------------------------------------------------------
To unsubscribe, e-mail: [email protected]
For additional commands, e-mail: [email protected]